Fig. 5.
Download original image
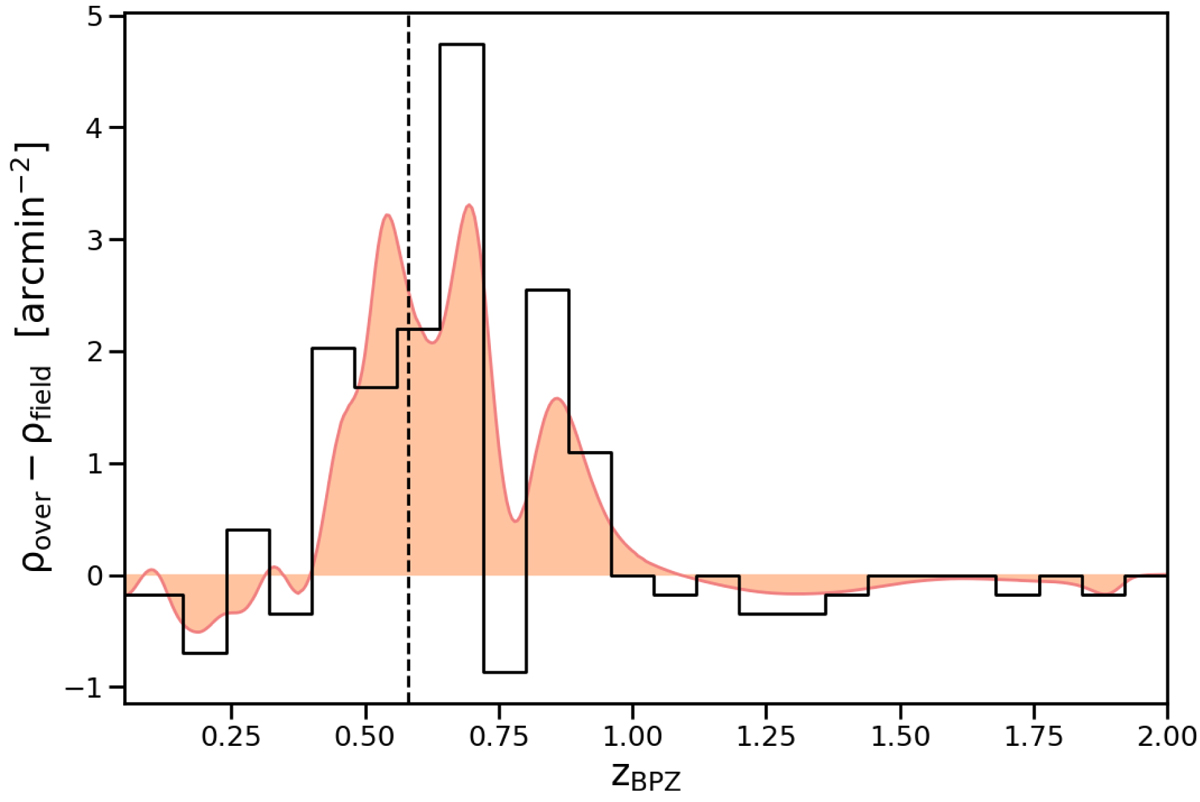
Difference between the redshift distribution functions of galaxies located within 0.5′ of the main ultra-massive lens galaxy at z = 0.581, and over the rest of the 2.5′ × 2.5′ field, after normalizing to the same area (orange curve). The black histogram is obtained from the peak of the redshift distribution of each source. A total of 14 galaxies within 0.5′ of the main deflector have redshifts consistent, at the 2σ confidence level, with z = 0.581, and 39 over the rest of our analyzed field.
Current usage metrics show cumulative count of Article Views (full-text article views including HTML views, PDF and ePub downloads, according to the available data) and Abstracts Views on Vision4Press platform.
Data correspond to usage on the plateform after 2015. The current usage metrics is available 48-96 hours after online publication and is updated daily on week days.
Initial download of the metrics may take a while.