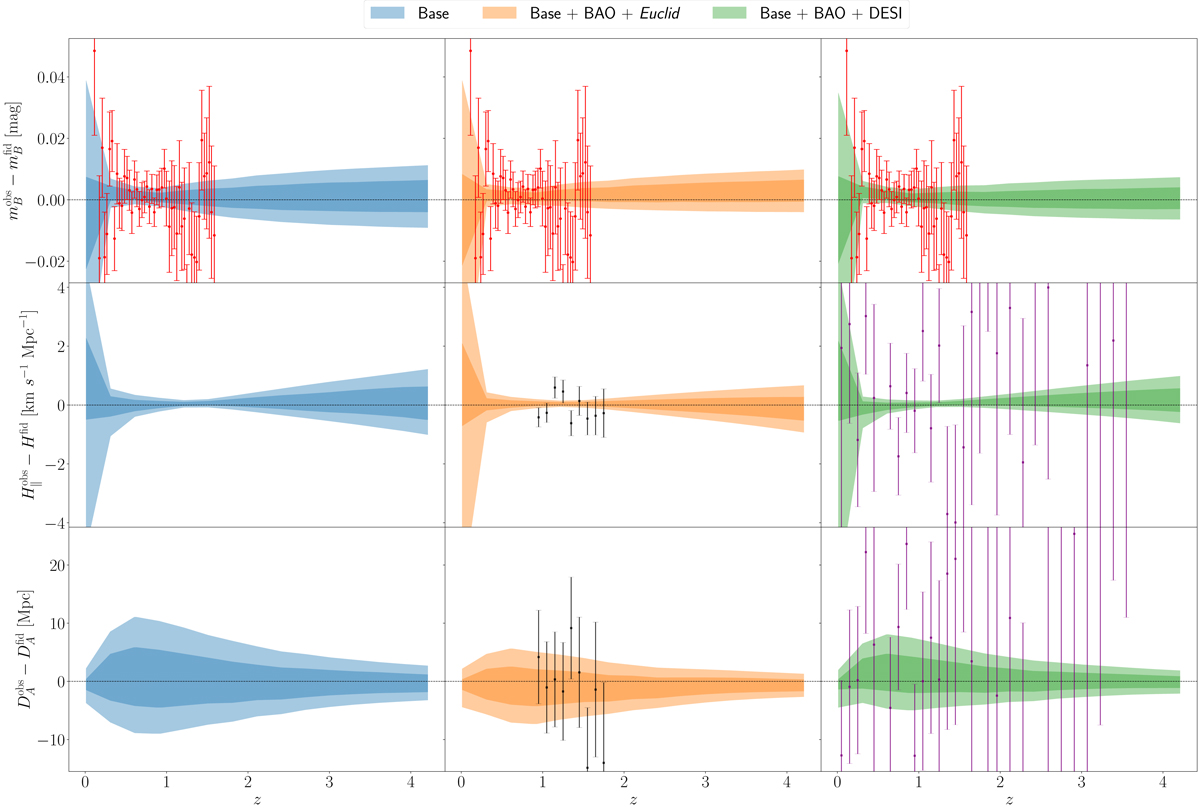
Fig. 4.
Download original image
Fluctuations in the apparent magnitude (top row), Hubble rate (middle row), and angular diameter distance (bottom row) for the ΛLTB model as compared to the fiducial ΛCDM one. The 68% and 95% bands are obtained by evaluating the relevant functions at every point of the chains. The red points show LSST and Euclid DESIRE SN data, the black ones Euclid data, and the purple ones DESI data. See Sect. 6.1.
Current usage metrics show cumulative count of Article Views (full-text article views including HTML views, PDF and ePub downloads, according to the available data) and Abstracts Views on Vision4Press platform.
Data correspond to usage on the plateform after 2015. The current usage metrics is available 48-96 hours after online publication and is updated daily on week days.
Initial download of the metrics may take a while.