| Issue |
A&A
Volume 671, March 2023
|
|
|---|---|---|
| Article Number | A70 | |
| Number of page(s) | 10 | |
| Section | Celestial mechanics and astrometry | |
| DOI | https://doi.org/10.1051/0004-6361/202244537 | |
| Published online | 08 March 2023 | |
The Neptunian gravity estimated from the motion of Triton based on astrometric observations
1
State Key Laboratory of Information Engineering in Surveying, Mapping and Remote Sensing, Wuhan University,
129 Luoyu Road,
Wuhan
430070, PR China
e-mail: This email address is being protected from spambots. You need JavaScript enabled to view it.
2
Purple Mountain Observatorys, Chinese Academy of Sciences,
Nanjing
210033, PR China
3
Geodesy Observatory of Tahiti, University of French Polynesia,
BP 6570,
98702
Faa’a Tahiti, French Polynesia, France
Received:
19
July
2022
Accepted:
27
January
2023
Abstract
Context. Accurate gravity and ephemerides estimations for Neptune and its satellites are necessary for the forthcoming deep space exploration missions targeting its system. In addition, these estimations are also meaningful for the modeling of Neptune's interior and for solar system dynamics studies. The body of astrometric data concerning Triton has been accumulating for about two hundred years, but more accurate updates to the ephemerides of this moon and revisions to the relevant gravity parameters would be possible with more precise astrometric data. The new Gaia catalog of star positions plus observations from Voyager 2 and the Hubble Space Telescope provide such a basis for high-precision astrometry and to complement and extend the existing body of data.
Aims. We aim to report integrated orbital fits for Triton based on all the available astrometric data from 1847 to 2020, including observations from Earth-based telescopes, Voyager 2, and the Hubble Space Telescope. We also estimate the Neptunian gravity using the motion of Triton.
Methods. Triton’s orbital solution was determined by a weighted least-squares method to fit the model to the most complete astrometric data set to date. The DOP853 algorithm was adopted in the numerical integration calculations. For the dynamical model parameters, our orbital model for Triton is similar to the NEP081 but with an update. The perturbations from the inner satellites (Naiad, Thalassa, Despina, Galatea, Larissa, Proteus, and Hippocamp) were considered by adding corrections to J2 and J4 for Neptune. As the gravitational oblateness coefficient of Neptune is correlated with its orientation, the pole parameters were thus kept fixed in the integration when estimating Neptunian gravity. A Monte Carlo analysis was performed, however, to obtain reliable accuracy estimations and to assess the uncertainty of pole parameters on the results’ formal error.
Results. We provide a new orbit and dynamical model values for Triton. The estimated accuracy of the model we built and updated fit all the astrometric data. The RMS of the residuals was 0.074 arcsec in the right ascension and 0.071 arcsec in declination. The RMS was 0.102 arcsec for X and 0.139 arcsec for Y in differential coordinates. The RMS for the position angle was 0.834 degrees, and the angular separation distance was 0.257 arcsec for the data collected before 1960. The orbit of Triton was well determined with the orbit differences from NEP081 and NEP097 (so far the latest Triton ephemerides from Jet Propulsion Laboratory) as being less than 300 km (about 15 mas) during the observation coverage period of this study. The large body of astrometric data for Triton over a time interval from 1847 to 2020 was used to constrain its position at the initial epoch, allowing us to reduce formal uncertainty to about 3 km. Based on the most complete weighting astrometric observations of Triton, the estimated mass of the Neptune system is GMs = 6 836 525.210 ±19.526 km3 s−2. Our revised gravity model yields J2 = 3401.655 ±1.850 × 10⁻⁶ and J4 = −33.294 ±10.000 × 10⁻⁶. The astrometric observations showed little sensitivity to GMs and J4, but acted well on J2. A Monte Carlo method was used to analyze the error caused by a variation in the pole parameters and showed that J2 = 3401.655 ± 3.994 × 10⁻⁶ was a more realistic error.
Key words: astrometry / celestial mechanics / planets and satellites: individual: Neptune / planets and satellites: individual: Triton
To show the usage of the elements in the author field.
The Authors 2023
 Open Access article, published by EDP Sciences, under the terms of the Creative Commons Attribution License (https://creativecommons.org/licenses/by/4.0), which permits unrestricted use, distribution, and reproduction in any medium, provided the original work is properly cited.
This article is published in open access under the Subscribe to Open model. This email address is being protected from spambots. You need JavaScript enabled to view it. to support open access publication.
1 Introduction
Outer planets and their satellites, such as Neptune and Triton, are of great interest to various fields of solar system studies. Triton, with a mean radius of 1353.4 km (Tyler et al. 1989), is the only large satellite with a retrograde orbit in the Neptunian system. It has an inclined retrograde orbit and could have once been part of a binary set of planets orbiting around the Sun. Alternatively, Triton could have been a Kuiper belt object before being captured around Neptune (Agnor & Hamilton 2006; Masters et al. 2014). China and the United States have proposed various deep space exploration missions related to the Neptunian system in order to answer this question, where Triton came from, and others (e.g., Exploring the solar system boundary mission and NASA’s Trident mission; Wu et al. 2019; Tian et al. 2021; Prockter et al. 2019; Mitchell et al. 2019). The study of the outer planetary satellites touches on orbital dynamics, planetology, and the origins of minor bodies of the Solar System (Emelyanov 2010), and good orbital knowledge of outer planetary satellites is a prerequisite for mission planning and operations (Brozovic & Jacobson 2022). Ephemerides also have important scientific applications. Therefore, high-precision data of Neptune’s satellite ephemerides and dynamical, relevant parameters are needed to support these and similar missions, as Voyager 2 did or the TRIDENT team proposed, as well as the dynamical and physical studies of the Neptunian system.
There are many astrometric observations of Triton. This satellite has been continually observed via micrometric, photographic, and charge-coupled device (CCD) cameras since it was first discovered by William Lassell (Lassell 1846). There were also close observations of the Neptunian system by the Voyager 2 spacecraft on August 25, 1989 (Smith et al. 1989; Owen et al. 1991). Voyager 2 provided the most accurate data for Triton (Jacobson 1991). The new Gaia catalog offers new opportunities for high-precision astrometry, and even early CCD images can also be reprocessed to get more positions with higher precision under the frame of Gaia DR2 (Tang et al. 2020; Yan et al. 2020). Importantly, all these astrometric observations of Triton could contribute to ephemeris precision and a new accurate background of the gravitational field.
Generally speaking, new observations and ephemerides improve our understanding of Triton’s orbit and the related dynamical model. By combining all the observations from 1847 to 2008, including Earth-based astrometric observations, image and radio-tracking, and occultation data of Voyager 2, Jacobson (2009) provided an accurate numerical orbit of Triton as well as Neptune’s pole and gravitational harmonics. Later, an analytical theory of Triton’s motion fitting all published observations made from 1847 to 2012 was given by Emelyanov & Samorodov (2015). Tang et al. (2020) corrected the initial states of Triton with some more new precise observations. Not only can Triton’s orbit be refined through astrometric observations, but Neptune’s pole orientation and gravitational harmonics can also be more accurately defined. For example, Yuan et al. (2021a) refined the values of the Neptunian pole orientation by processing all available astrometric data of Triton and Nereid. Brozović et al. (2020) yielded a new value for Neptune’s oblateness coefficient of J2 by integrating orbital fits for the inner regular moons of Neptune based on astrometric data. The signature of Neptunian system properties is contained in Triton’s motion and can be obtained from astrometric data of the natural satellite.
However, astrometric data for Neptune’s inner regular moons are scarce, with less than 200 data points per moon (Brozović et al. 2020). This leads to large orbital uncertainties regarding the inner satellites, Naiad, Thalassa, Desina, Galatea, Larisis, Hippocamp, and Proteus. The estimation accuracy of the dynamical model is also seriously affected by the error of satellites’ orbit. But different from the inner regular moons, Triton has many astrometric observations. Therefore, our study presents an analysis of the Neptunian gravity estimation from the motion of Triton based on the numerous astrometric observations of Triton. In this paper, a new orbit of Triton is presented using all the available astrometric observations from 1847 to 2020. Similar to the work of Jacobson (2009) and previous studies, as well as many studies of other natural satellite systems, we used the orbital motion of Triton to refine the values of gravitational effects due to the oblateness of Neptune.
The present paper is arranged as follows. In Sect. 2, we present all the observations we used in the orbit determinations and our numerical orbital model update for Triton. Our results for Triton's orbit and adjusted dynamical parameters of Neptune’s gravitational field are given in Sect. 3. In our results, the pole parameters were kept fixed in the integration. Therefore, we discuss the effects induced by the uncertainties of the pole parameters in Sect. 4. Finally, in Sect. 5, we summarize our findings.
2 Method
To determine the orbit of Triton, we used the precise orbit determination program developed by Wuhan University (Yan et al. 2017, 2019). The DOP853 algorithm was adopted for the numerical integration calculations of the satellite’s orbit. The errors of integrating back and forth with the time span over one century was only about a hundred meters, which meets our accuracy requirements. Using a weighted least-squares method, we determined the orbit of Triton by fitting the most complete astrometric data set to date. In addition, we updated the properties of the planetary system of Neptune from the motion of Triton. These observations were collected from 1847 to 2020 by Earth-based telescopes, the Hubble Space Telescope (HST), and Voyager 2.
2.1 Observations
We distributed all observations into groups based on observatory and type for data weighting. We obtained 32 groups of observations, which are summarized in Table 1. Similar to Emelyanov & Samorodov (2015), we hypothesized that observations in a group have the same accuracy, which was necessary to provide weights for conditional equations used to refine the orbital parameters by the least-squares method. In our work, we obtained the RMS of the post-fit residuals after outlier rejection through the Isolation Forest algorithm (Liu et al. 2008). Then, we assigned the weights to each group of observations in accordance with the RMS of the post-fit residuals, shown under RMS1 and RMS2 in Table 1.
To determine Triton’s orbit, we used all the available astro-metric observations from 1847 to 2020. Since 1847, many micro-metric observations of Triton have been made. In the early years, the observation types are described as position angle p measured from the direction to the true north of the date epoch and angular separation distance s between the center of Neptune and Triton. Position angle p and angular separation distance s were not measured at the same time in most cases. These two angles can be expressed as:
 (1)
(1)
where δ0 and δ are the declination of Neptune and Triton, respectively. While α0 and α are the right ascension of these two bodies, ∆α = α − α0 is the difference in right ascension between them. The value of p is in degrees, while for s, the value is measured in arcseconds.
With the development of technology, photographic and CCD camera observations appeared. These observations now provide relative and absolute angular observations. The absolute observation type is described as:
 (2)
(2)
where R represents the state vectors of Triton in the International Celestial Reference Frame (ICRF), and Rx, Ry, and Rz are X-Y-Z components. The right ascension α and declination δ give Triton’s positions on the celestial sphere in the equatorial coordinate system. The values X and Y provide Triton’s position relative to the center of Neptune. The differential coordinates (X, Y) are described as:
 (3)
(3)
and these notations are the same as those in Eqs (1) and (2)
The data were aggregated to the Natural Satellites Data Center on the website of the Institute of Celestial Mechanics and Computation of Ephemerides (IMCCE)1, however, for the data published during the 19th and at the beginning of the 20th centuries, there were problems. For example, the timescale could not be identified from the publication, and sometimes it was not clear whether reductions had been made (Emelyanov & Samorodov 2015). Furthermore, absolute observations always include systematic error due to inaccuracy in the star coordinates taken from star catalogs. Thus, we used the complete observational catalog of Neptunian satellites, OCANS-8-20202, which was obtained by systematic collation and time-space unification and corrected for star catalog bias with respect to Gaia-DR2 (Yuan et al. 2021a,b).
The observations we specifically used were collected by Earth-based telescopes, HST, and Voyager 2. In addition to OCANS-8-2020, we used new Earth-based observations of Triton from Yan et al. (2022) and Zhang et al. (2021, Zhang et al. 2022). We also used about 40 differential coordinates of Triton from HST obtained by Showalter et al. (2019), which were used in a previous work by Yuan et al. (2021a). The quantity of space-based astrometric data for Triton is far less than that of the Earth-based data, but it contains the most accurate relative observations, about 10 mas of accuracy.
Additionally, we used the observations from Voyager 2 published by Jacobson (1991). These observations were also used in orbit determinations by Emelyanov & Samorodov (2015) and Tang et al. (2020). The corresponding file vgr2-nep081.bsp3 provides the positions of the Voyager 2 spacecraft that were used to calculate theoretical observations to compare with the measured data. However, we did not use all the observations of Triton made with Voyager 2 because of the limit of this file. In total, 359 observations from Voyager 2 were used in our fit.
Overall, 40 observations from HST and 359 observations from Voyager 2 were used. Additionally, the Earth-based astro-metric observations of Triton gave 24119 conditional equations (N1+N2 in Table 1). These data made at the 173-yr interval, since 1847 to 2020.
Triton observation residual statistics.
 |
Fig. 1 Differences between the positions from NEP081 and from NEP097. The differences are shown in the orbit radial (R), transverse (T), and out-of-plane (N) directions. These two Triton ephemerides have different orbital models. The model for NEP081 assumes the inner satellites are massless and do not gravitationally attract Triton. The model for NEP097 assumes the orbit of Triton is influenced by the perturbations from the inner regular satellites of Neptune. As NEP081 only provides ephemeris data between 1900 and 2100, we have made the comparison within this time span. |
2.2 Orbital model
Triton is a fairly massive Neptunian satellite. Its motion is influenced by Neptune’s oblateness and solar planet attractions. Other satellites of Neptune also affect Triton s motion, but the perturbations are rather small and exert negligible influence on its motion, as considered in Jacobson (2009), Emelyanov & Arlot (2011), Emelyanov & Samorodov (2015), and Tang et al. (2020). Triton’s orbit, however, is strongly influenced by the perturbations from the inner regular satellites of Neptune, as indicated by the NEP097 ephemeris reported by the NASA Jet Propulsion Laboratory (Brozović, priv. comm.) and the FORCES-8-MAIN-2020 ephemeris developed by Yuan et al. (2021a). In our experiments and in the work of Yuan et al. (2021a), the perturbations from inner regular satellites are roughly 1000 km positional differences over a century integration time. In Fig. 1, we comprehensively compare this difference in ephemerides from different orbital models of Triton.
Figure 1 shows the differences of Triton ephemerides between the position from NEP081 (Jacobson 2009) and from NEP097 in the orbit radial (R), transverse (T), and out-of-plane (N) directions. These two ephemerides are based on different orbital models. The model for NEP081 assumes the inner satellites are massless and do not gravitationally attract Triton. In NEP097, the model assumes Triton’s orbit is influenced by the perturbations from the inner regular satellites of Neptune. As NEP081 only provides the ephemeris between 1900 and 2100, we have only made the comparison within this time span. Generally speaking, the change in the orbit radial direction of Triton is mainly due to the difference in the orbital precession caused by Neptune s gravitational harmonics; the slope in the transverse difference is the result of the changes in the mean motions of Triton; and the out-of-plane change indicates an inclination change (Jacobson 2009). In the comparison period, Fig. 1 shows the main differences of Triton ephemerides between NEP081 and NEP097 are in the transverse direction (less than 100 km) and out-of-plane direction (less than 500 km). This means that the main discrepancy between these two Triton ephemerides is the orbital inclination. Meanwhile, the deviations of the theoretical observations obtained from these two ephemerides are less than the observational accuracy of astrometric data. Therefore, the ephemerides of Triton developed by these two types of orbital models have a certain difference but both fit the available observations.
Our orbital model for Triton is similar to the NEP081 model proposed by Jacobson (2009) but has an update. The perturbations from the inner satellites (Naiad, Thalassa, Despina, Galatea, Larissa, Proteus, and Hippocamp) were considered by adding corrections to J2 and J4 for Neptune (e.g., Emel'Yanov & Kanter 2005; Yuan et al. 2021a) as follows:
 (4)
(4)
where mi(i = 1,…, M) are the masses of the M main satellites of Neptune and ai(i = 1,…,M) are the radii of their orbits. The mass and the reference radius for Neptune are represented by m0 and R, respectively. These values were obtained from NEP097. In contrast to NEP081 model, our orbital model takes into account the perturbations from Neptunian inner satellites, and compared to NEP097 model, we have improved computational efficiency. Table 2 summarizes the initial conditions and dynamical parameters used in integration.
As also described in Table 2, the point-mass gravitational effects of Neptune, the second and fourth zonal harmonics of Neptune’s gravity field and the point-mass perturbations from the Jupiter, Saturn, and Uranus systems as well as the masses of the Sun and inner planets were taken into account. Gravitational effects of the inner satellites were accounted for by adding corrections to J2 and J4. We used DE440 planetary ephemerides (Park et al. 2021) for the orbits of outer planets. We solved for the state vectors, the GM of the Neptunian system (GMs), J2, and J4, indicated by [a] in Table 2. The gravitational oblateness coefficient of Neptune is correlated with the orientation of Neptune; thus, the pole parameters were kept fixed in the integration when estimating the Neptunian gravity, just as Brozović et al. (2020) did.
In addition, barycentric dynamical time (TDB) was used as the coordinate time, and the equations of Triton’s motion were in the ICRF. The initial date of Triton’s orbit integration was set to t0 = 2447 763.5(TDB) on August 25, 1989, which meets the moment of Voyager’s encounter. Meanwhile, we obtained the coordinates of the pole of Neptune from the following relationships (Emelyanov 2020):
 (5)
(5)
 (6)
(6)
these values were taken from Jacobson (2009), and the expression for ΩT was reduced to the initial epoch J2000. And we have
 (7)
(7)
where T is the interval in Julian centuries (36 525 days) from the standard epoch. The above angles were measured in degrees.
Initial parameters of Neptune used in the dynamical model.
3 Results
We determined the orbits of Triton by adjusting the parameters in our dynamical and observational models to fit the most complete astrometric data set in a weighted least-squares method. The dynamical parameters were the epoch position and velocity of Triton, the GMs of the Neptunian system, and the second and fourth zonal harmonics of Neptune’s gravity field. We also imposed apriori constraints (apriori standard deviations) on several of the parameters. Our a priori constraint on GMs was set to twice its error bar, 20 km3 s−2 from Jacobson (2009). Though J2 was not constrained, an a priori standard deviation for J4 was set to 10.0 ×10⁻⁶ because J4 is too small to be reliably detected from the astrometric data (Yuan et al. 2021a). The Isolation Forest algorithm was used to judge the normal and abnormal residuals in the data-fitting process. After rejecting the abnormal residuals, we estimated the parameters and obtained the RMS of post-fit residuals for each group. To get our final solution, we assigned the weights in accordance with the RMS of post-fit residuals and re-estimated the parameters.
Summary of the dynamical parameter determinations.
3.1 State vectors and residuals
After the fitting process, our final results yielded position and velocity for Triton at t0, shown in Table 3. In Table 3, we present our solution results for the state vector of Triton (SOL.) and a reference solution (Ref.) from Jacobson (2009). We denote the parameter value difference between SOL. and Ref. as well as the formal 1σ uncertainty in our solution.
As seen in Table 3, there is a position (X, Y, and Z) deviation of roughly 10 km and a velocity (Vx, Vy, and Vz) change of less than 0.1 m/s shown under ∆. The formal uncertainty in Triton’s position at the initial epoch was reduced to about 3 km given the amount of Triton astrometric observations over the long time interval (1847 to 2020). At the initial epoch, August 25, 1989, the deviations of Triton’s position are about three times our formal uncertainty. This is reasonable because the data we used do not include Voyager 2 radio tracking data, which makes our solution slightly different from the solution of Jacobson (2009) at the initial epoch. There have been many new observations of Triton since the work of Jacobson (2009). A long cover time of observations constrains its position down to a formal 1σ uncertainty of about 3 km, similar to the results of Yuan et al. (2021a). To further analyze the accuracy of our Triton orbit, we also compared it with NEP081 and NEP097.
The comparison of our new extrapolated Triton ephemeris results with the NEP081 and NEP097 ephemerides is shown in Fig. 2. Because NEP081 provides the ephemeris after 1900, we only made a comparison from 1900 to 2050. As can be seen, the ephemeris distance deviations between our new ephemeris and the NEP081 and NEP097 ephemerides are within 300 km for 150 yr. At Neptune’s average distance, 1 arcsec is approximately equal to 21000 km. Therefore, the difference in astrometric data calculation between the ephemerides is less than 15 mas. This indicates that the three Triton orbit models are quite similar. In the RTN frame, the main difference between our Triton orbit model and NEP081 is in the transverse direction, which indicates the changes in the mean motions. There is also a significant difference regarding Triton’s orbit in the out-of-plane direction for our results and NEP097. This is directly related to an inclination difference. The discrepancies mostly come from the variation in the initial vector of Triton at Voyager’s encounter, the type of orbital models, and model parameter values. These discrepancies, however, are difficult to observe in astronomical observations, and the three ephemerides fit the available observations.
In our experiments with data before 1960, the residuals of type p did not exceed three degrees, and type s was within 1.5 arcsec. After 1960, the residuals of X, Y, α, and δ did not exceed 1 arcsec. We also had residual RMS values for all observation types. The RMS of the residuals were 0.074 arcsec in the right ascension and 0.071 arcsec in the declination. The RMSs were 0.102 arcsec for X and 0.139 arcsec for Y in differential coordinates. The RMS for the position angle was 0.834 degrees, and the angular separation distance was 0.257 arcsec for the data collected before 1960. These results indicate improvement of observation accuracy driven by the advancement of technology. More precise observations will be available and contribute to future research. Figure 3 further shows the distributions of the weight residuals of all the available observations we used by dividing the residuals by their assigned weights.
The weight residuals in Fig. 3 are for the integrated orbit fit of all types of observations during the period from 1847 to 2020. The weights were assigned according to the RMS of post-fit residuals, shown in RMS1 and RMS2 of Table 1. If the weight RMS is less than one, the data weights are too loose, and if it is higher than one, the data weights are too tight (Brozović et al. 2020). As shown in Fig. 3, the weight RMS for the type p and s is 1.001; for the type X and Y,itis 1.123; and for the type α and δ, it is 0.901. The latter two weight RMSs are deviated slightly from one (deviation less than 0.13) because we were using the mean values of RMS1 and RMS2 as weights to the types X, Y and α, δ. In general, we considered the noise of these data to be Gaussian, time uncorrelated, and zero mean. Therefore, our integrated orbit fit of Triton shows that the weighted RMS approximately equals one for all observation types. This result indicates that the data weights adequately describe the data quality. Our final integrated ephemeris for Triton and the residuals of astrometric data are available online4.
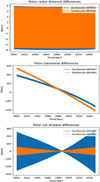 |
Fig. 2 Differences between the new ephemeris and NEP081 and NEP097. The differences are shown in the orbit radial (R), transverse (T), and out-of-plane (N) directions. As NEP081 provides ephemeris data only after 1900, the comparison is from 1900 to 2050. |
3.2 Adjusted dynamical parameters
Not all dynamical parameters for Neptune (GMs, J2, J4, and pole orientation parameters) can be simultaneously improved with astrometric observations. Some were well constrained with the Voyager radiometric tracking data. Unlike the radio science data for the Moon and Mars (e.g., Konopliv et al. 2016), the astromet-ric observations of Triton have their own limits on the dynamical parameter solution. The correlations between the gravitational oblateness coefficient and the orientation of Neptune are difficult to decouple. Unlike Yuan et al. (2021a), we kept the pole parameters fixed in our orbit-fitting process to estimate the GMs of the Neptunian system, J2, and J4.
Figure 4 shows the correlation coefficients between the dynamical parameters. It clearly shows that the correlation between the satellite state vectors and the gravitational field parameters are weak, especially for J4. The correlation between gravitational field parameters are also greatly reduced.
The adjusted state vectors and the gravitational field coefficient of Neptune are also summarized in Table 3. The fitted GMs for Neptune are GMs = 6 836525.210 ± 19.526 km3 s−2. The revised gravity model yielded J2 = 3401.655 ± 1.850 × 10⁻⁶ and J4 = −33.294 ± 10.000 × 10⁻⁶. We found that the formal error of our parameter solution on J2 was two times smaller than the result of (Jacobson 2009), J2 = 3408.4 ± 4.5 × 10⁻⁶. Our result is also better than that of Brozović et al. (2020), J2 = 3409.1 ± 2.9 × 10⁻⁶. Though Neptune’s central gravity is Triton’s main perturbation, the astrometric data works little on it. The formal error from our result is close to its own a priori constraint, and it is twice the formal error from Jacobson (2009), GMs = 6 836527.1 ± 10.0 km3 s−2. Especially for J4, the astrometric observations showed no sensitivity to J4 (Yuan et al. 2021a). The uncertainty of J4 shows almost no decrease from a priori constraint. In the next paragraph, we analyze the sensitivity of astronomical observations to gravitational field coefficients.
Figure 5 shows the first-order partial derivatives of the astronomic observations from 1847 to 2020 with respect to the GMs of the Neptunian system, J2 and J4. As this figure presents, there are orders of magnitude of difference in sensitivity among GMs, J2 and J4. The sensitivity of astrometric observations regarding the GMs is on a magnitude of 100. For J2, it is on a magnitude of 104. And for J4, it is on the order of 102. The GMs of the Neptunian system are well constrained with the Voyager radiometric tracking data by Jacobson (2009). In addition, the astrometric data shows no sensitivity to the value of the GMs of the Neptunian system. A low sensitivity of the astronomic data to J4 also limits our ability to further constrain this parameter. This is why we were able to constrain J2 well, while the GMs and J4 were not determined at a high accuracy.
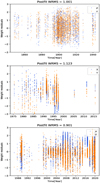 |
Fig. 3 Weight residuals for the integrated orbit fit for all observation types from 1847 to 2020. The weights were assigned in accordance with the RMS of post-fit residuals shown under RMS1 and RMS2 in Table 1. |
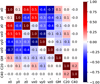 |
Fig. 4 Correlation coefficients between the dynamical parameters |
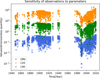 |
Fig. 5 First-order partial derivatives of the astronomic observations with respect to the GMs of the Neptunian system, J2, and J4. |
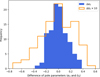 |
Fig. 6 Distributions of pole parameters in MC analysis. To better show the distribution of values, we expanded the value of ∆δ0 by a factor of ten. |
4 Discussion
In our results, the pole parameters were kept fixed in the integration. However, the effects induced by the uncertainties of the pole parameters on the adjusted parameters needed to be considered. Thus, to assess this effect on the formal error in the results, we performed a Monte Carlo (MC) analysis. We obtained reliable accuracy estimations of the Neptunian gravity parameters based on astrometric observations of Triton.
We performed an MC analysis by varying the pole parameters of α0 and δ0 with a Gaussian distribution where the means are the nominal values and standard deviations were extracted from the error bars. As shown in Fig. 6, we repeated 100 cases, randomly changing the pole parameters of Neptune. By varying the pole parameters of α0 ± 0.14 degrees and δ0 ± 0.03 degrees (from Jacobson 2009) with a Gaussian distribution, the variation of α0 ranged from -0.4 to 0.4 degrees, and δ0 ranged from -0.08 to 0.06 degrees. We obtained 100 possible solutions, compared to the nominal solution in Table 3.
The effects induced by the uncertainties of the pole parameters on adjusted parameters were assessed by the MC method. Generally speaking, the uncertainty of the solution can be measured by the RMS of the differences between the possible solutions from the cases we repeated and the nominal solution in Table 3 (Yuan et al. 2021a). The MC 1σ uncertainties were 3.413, 3.154, and 1.827 km in X, Y, and Z of the initial epoch. However, we found the influence of the pole variation to be greater on the Triton integrated ephemeris. Figure 7 shows the distance between Triton’s possible integrated ephemerides and the nominal integrated ephemeris in Sect. 3.1 in two moments, at initial time and at the end of integration time. These possible Triton ephemerides have different pole parameters. As can be seen, the orbital differences are less than 10 km at the initial epoch moment. Triton’s position at epoch was well constrained, owing to the observations from Voyager 2. But for Triton’s integrated orbit of 150 yr, the difference with the deviation of the pole parameter became progressively larger (maximum deviation over 2000 km, minimum deviation less than 50 km). This effect means that the pole parameters and the gravity field coefficients have their own matching. Although the values of the polar variation are small, the orbital deviation caused by the long time integration for Triton is larger than the observational accuracy. There are many different Triton ephemerides with different pole parameters and gravity field coefficients of Neptune. For example, Yuan et al. (2021a) refined the values of the Neptunian pole orientation. Brozović et al. (2020) yielded a new value for Neptune’s oblateness coefficient of J2. But we cannot take the gravity field coefficients and initial orbits from (Brozović et al. 2020) and then take the new pole parameters from (Yuan et al. 2021a), as incorrect matching of gravity field coefficients and the orientation parameter model can lead to the wrong integration orbits of Triton (i.e., deviations over 2000 km).
Figure 8 shows the distributions of the GMs, J2, and J4 deviations between the possible solutions and the nominal solution. As can be seen in this figure, the results of the three parameters also obey Gaussian distribution; their data sets with the p value are more than 0.05 alpha, from Shapiro–Wilk test (Shapiro & Wilk 1965). The changes in solution values of GMs vary from −8 to 4, while J2 varies in −10 ~ 6 × 10⁻⁶, and J4 varies in −0.1 ~ 0.17 × 10⁻⁶. These deviations were the errors due to a variation in the pole parameters. The MC 1σ uncertainties were 2.204 in the GMs, 3.994 × 10⁻⁶ in the J2, and 0.066 × 10⁻⁶ in the J4. We found that the formal error of GMs and J4 are close to their a priori constraints, while the errors due to a variation in the pole parameters are small.
The GMs and J4 were solved around their nominal values, which means that these two parameters are insensitive to changes in the orbit of Triton. Therefore, in our experiments, an accurate a priori value of both GMs and J4 are required. This result also indicates that the pole variation mainly caused the variation in J2, whose changes are beyond of its own error bar. Combining the formal error of J2, which is a result of the weights of the observations, and the error caused by a variation in the pole parameters, we believe the MC 1σ uncertainties of J2 = 3401.655 ±3.994 × 10⁻⁶ is a more realistic error than the formal error, as the sources of error are independent.
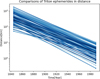 |
Fig. 7 Distance between Triton’s possible integrated ephemerides and the nominal integrated ephemeris. These possible Triton ephemerides have different pole parameters. We made the comparison at two moments: initial time and at the end of integration time. The different colors represent 100 cases in MC analysis. |
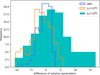 |
Fig. 8 Distributions of the GMs, J2, and J4 deviations between the possible solutions and the nominal solution. To better show the distribution of values, we expanded the value of ∆ J2 and ∆ J4. |
5 Conclusion
The present paper presents a new numerical dynamical model of Triton’s motion that fits all available astrometric data. In addition to data from the OCANS-8-2020 observational catalog of Neptunian satellites from Yuan et al. (2021a,b), new observations of Triton from Yan et al. (2022) and Zhang et al. (2021, 2022) were included in our fitting. The expansion for the pole of Neptune in J2000 was deduced from the work of Jacobson (2009). The pole parameters were kept fixed in the integration, but the gravitational field parameters were estimated. We used the weighted least-squares method to obtain the new motion of Triton.
In the fitting process, our new orbit model of Triton was well determined, with the deviations from NEP081 and NEP097 being less than 300 km (about 15 mas) during the observation coverage period. The formal uncertainty of Triton’s position at initial epoch was reduced to about 3 km. We also determined the gravitational field parameters of Neptune. The fitted GMs for Neptune are GMs = 6 836 525.210 ± 19.526 km3 s−2. The revised gravity model yielded J2 = 3401.655 ± 1.850 × 10⁻⁶ and J4 = −33.294 ± 10.000 × 10⁻⁶. The astrometric observations showed little sensitivity to GMs and J4, but acted well on J2. Our analysis of the error due to a variation in the pole parameters using the Monte Carlo method showed that J2 = 3401.655 ±3.994 × 10⁻⁶ is a more realistic error based on the published pole formal errors of Jacobson (2009).
Acknowledgements
This research is supported by the National Natural Science Foundation of China (42241116, 42030110, U1831132) and open project of State Key Laboratory of Lunar and Planetary Science, Macau University of Science and Technology (SKL-LPS(MUST)-2021-2023). J.P.B. was funded by a DAR grant in planetology from the French Space Agency (CNES). The numerical calculations of this paper have been done in the Supercomputing Center of Wuhan University.
References
- Agnor, C. B., & Hamilton, D. P. 2006, Nature, 441, 192 [NASA ADS] [CrossRef] [Google Scholar]
- Aitken, R. 1899, Astron. Nachr., 149, 373 [NASA ADS] [CrossRef] [Google Scholar]
- Aitken, R. G. 1904, Lick Observ. Bull., 2, 157 [CrossRef] [Google Scholar]
- Albrecht, S., & Smitil, E. 1909, Lick Observ. Bull., 5, 109 [Google Scholar]
- Alden, H. L. 1940, AJ, 49, 70 [NASA ADS] [CrossRef] [Google Scholar]
- Alden, H. L. 1943, AJ, 50, 110 [NASA ADS] [CrossRef] [Google Scholar]
- Balanovskii, I. A. 1923, Mitteilungen der Nikolai-Hauptsternwarte zu Pulkowo (Princeton: Princeton University), 86 [Google Scholar]
- Barnard, E. 1893, AJ, 13, 10 [CrossRef] [Google Scholar]
- Barnard, E. 1894, AJ, 14, 9 [NASA ADS] [CrossRef] [Google Scholar]
- Barnard, E. 1895, AJ, 15, 41 [NASA ADS] [CrossRef] [Google Scholar]
- Barnard, E. 1898, AJ, 19, 25 [NASA ADS] [CrossRef] [Google Scholar]
- Barnard, E. 1899, AJ, 20, 41 [NASA ADS] [CrossRef] [Google Scholar]
- Barnard, E. 1901, AJ, 22, 27 [NASA ADS] [CrossRef] [Google Scholar]
- Barnard, E. 1903, AJ, 23, 105 [NASA ADS] [CrossRef] [Google Scholar]
- Barnard, E. 1906a, AJ, 25, 41 [NASA ADS] [CrossRef] [Google Scholar]
- Barnard, E. 1906b, AJ, 25, 100 [NASA ADS] [CrossRef] [Google Scholar]
- Barnard, E. 1907, AJ, 25, 164 [NASA ADS] [CrossRef] [Google Scholar]
- Barnard, E. 1910, AJ, 26, 144 [NASA ADS] [CrossRef] [Google Scholar]
- Barnard, E. 1912, AJ, 27, 111 [NASA ADS] [CrossRef] [Google Scholar]
- Barnard, E. 1913, AJ, 28, 10 [NASA ADS] [CrossRef] [Google Scholar]
- Barnard, E. 1915, AJ, 29, 39 [CrossRef] [Google Scholar]
- Barnard, E. 1916, AJ, 30, 2 [NASA ADS] [CrossRef] [Google Scholar]
- Barnard, E. 1917, AJ, 30, 214 [CrossRef] [Google Scholar]
- Barnard, E. 1919, AJ, 32, 103 [NASA ADS] [CrossRef] [Google Scholar]
- Barnard, E. 1927, AJ, 37, 127 [NASA ADS] [CrossRef] [Google Scholar]
- Barnard, E. E. 1909, Astron. Nachr., 181, 321 [NASA ADS] [CrossRef] [Google Scholar]
- Bower, E., & Hall, A. 1923, AJ, 35, 108 [NASA ADS] [CrossRef] [Google Scholar]
- Brozović, M., & Jacobson, R. A. 2022, AJ, 163, 241 [CrossRef] [Google Scholar]
- Brozović, M., Showalter, M. R., Jacobson, R. A., et al. 2020, Icarus, 338, 113462 [Google Scholar]
- Burton, H. 1913, AJ, 28, 44 [NASA ADS] [CrossRef] [Google Scholar]
- Burton, H., & Hall, A. 1919, AJ, 32, 113 [NASA ADS] [CrossRef] [Google Scholar]
- Christie, W. H. M. 1901, Greenwich Observations in Astronomy, Magnetism and Meteorology made at the Royal Observatory, 61, D240 [NASA ADS] [Google Scholar]
- Christie, W. H. M. 1904, Greenwich Observations in Astronomy, Magnetism and Meteorology made at the Royal Observatory, 64, G59 [NASA ADS] [Google Scholar]
- Christie, W. H. M. 1909, Greenwich Observations in Astronomy, Magnetism and Meteorology made at the Royal Observatory, 69, G207 [NASA ADS] [Google Scholar]
- Crawford, R. T. 1928, Lick Observ. Bull., 14, 8 [Google Scholar]
- Davis, C. 1874, MNRAS, 35, 49 [CrossRef] [Google Scholar]
- Dourneau, G., Le Campion, J., Bontemps, S., et al. 2015, Notes Scientifiques et Techniques de l’Institut de Mecanique Celeste (Paris: Institut de mécanique céleste et de calcul des éphémérides), 97 [Google Scholar]
- Dourneau, G., Le Campion, J., Rapaport, M., et al. 2007, Notes scientifiques et techniques de L’Institut de mécanique céleste, Paris: Institut de mécanique céleste et de calcul des éphémérides, CNRS UMR 8028/Observatoire de Paris, S089 [Google Scholar]
- Drew, D. 1897, AJ, 17, 131 [NASA ADS] [CrossRef] [Google Scholar]
- Drew, D. 1899, AJ, 20, 30 [NASA ADS] [CrossRef] [Google Scholar]
- Emelyanov, N. 2010, Planet. Space Sci., 58, 411 [NASA ADS] [CrossRef] [Google Scholar]
- Emelyanov, N. 2020, The Dynamics of Natural Satellites of the Planets (Amsterdam: Elsevier) [Google Scholar]
- Emelyanov, N. V., & Arlot, J.-E. 2011, MNRAS, 417, 458 [NASA ADS] [CrossRef] [Google Scholar]
- Emelyanov, N. V., & Samorodov, M. Y. 2015, MNRAS, 454, 2205 [Google Scholar]
- Emel’Yanov, N., & Kanter, A. 2005, Sol. Syst. Res., 39, 112 [CrossRef] [Google Scholar]
- Hall, A. 1876, Astron. Nachr., 88, 131 [Google Scholar]
- Hall, A. 1877, Astron. Nachr., 90, 161 [Google Scholar]
- Hall, A. 1900, AJ, 20, 191 [Google Scholar]
- Hall, A. 1911, AJ, 26, 179 [Google Scholar]
- Hall, A. 1920, AJ, 33, 62 [Google Scholar]
- Hall, A. 1922, AJ, 34, 18 [Google Scholar]
- Hall, A., & Burton, H. 1913, AJ, 28, 42 [NASA ADS] [CrossRef] [Google Scholar]
- Hammond, J. 1906, AJ, 25, 93 [NASA ADS] [CrossRef] [Google Scholar]
- Hammond, J., & Rice, H. 1905, AJ, 24, 188 [NASA ADS] [CrossRef] [Google Scholar]
- Harrington, R., & Walker, R. 1984, AJ, 89, 889 [NASA ADS] [CrossRef] [Google Scholar]
- Henry, P. 1884a, Bulletin Astronomique, Serie I, 1, 178 [NASA ADS] [Google Scholar]
- Henry, P. 1884b, Bulletin Astronomique, Serie I, 1, 89 [NASA ADS] [Google Scholar]
- Henry, P. 1886, Bull. Astron., 3, 488 [NASA ADS] [Google Scholar]
- Holden. 1881, Astronomical and Meteorological Observations made at the U.S. Naval Observatory, 17, 231 [Google Scholar]
- Hussey, W. J. 1899, AJ, 20, 71 [Google Scholar]
- Hussey, W. J. 1902, Lick Observatory Bulletin, 17, 139 [NASA ADS] [CrossRef] [Google Scholar]
- Jacobson, R. A. 1991, Astron. Astrophys. Suppl. Ser., 90, 541 [NASA ADS] [Google Scholar]
- Jacobson, R. A. 2009, AJ, 137, 4322 [Google Scholar]
- Kiseleva, T., Chanturiya, S., Vasil’eva, T., & Kalinichenko, O. 2012, Sol. Syst. Res., 46, 436 [NASA ADS] [CrossRef] [Google Scholar]
- Konopliv, A. S., Park, R. S., & Folkner, W. M. 2016, Icarus, 274, 253 [Google Scholar]
- Kostinsky, S. 1900, Astron. Nachr., 152, 277 [Google Scholar]
- Kostinsky, S. 1902, Astron. Nachr., 157, 287 [Google Scholar]
- Lassell, L. 1850, MNRAS, 10, 132 [NASA ADS] [CrossRef] [Google Scholar]
- Lassell, W. 1846, MNRAS, 7, 157 [Google Scholar]
- Lassell, W. 1849a, MNRAS, 10, 8 [Google Scholar]
- Lassell, W. 1849b, MNRAS, 9, 103 [Google Scholar]
- Lassell, W. 1851, MNRAS, 11, 61 [Google Scholar]
- Lassell, W. 1852a, MNRAS, 13, 37 [Google Scholar]
- Lassell, W. 1852b, MNRAS, 12, 155 [Google Scholar]
- Lassell, W. 1857, MNRAS, 17, 70 [Google Scholar]
- Lassell, W. 1864, MNRAS, 24, 209 [Google Scholar]
- Liu, F. T., Ting, K. M., & Zhou, Z. H. 2008, Proceedings - IEEE International Conference on Data Mining, ICDM, 413 [Google Scholar]
- Lohse, J. 1887, MNRAS, 47, 497 [Google Scholar]
- Martins, R. V., Veiga, C., Bourget, P., Andrei, A., & Descamps, P. 2004, A&A, 425, 1107 [NASA ADS] [CrossRef] [EDP Sciences] [Google Scholar]
- Masters, A., Achilleos, N., Agnor, C., et al. 2014, Planet. Space Sci., 104, 108 [NASA ADS] [CrossRef] [Google Scholar]
- Mitchell, K. L., Prockter, L. M., & Frazier, W. E. 2019, Astrobiology, 19, 1 [Google Scholar]
- Nikolaevich, N. G., & Dorimedontovich, P. K. 1926, Mitteilungen der Nikolai-Hauptsternwarte zu Pulkowo, 10, 418 [NASA ADS] [Google Scholar]
- Owen, W. M. 1999, Jet Propulsion Laboratory, 301–150, Pasadena CA 911098099 [Google Scholar]
- Owen, W. M., Vaughan, R. M., & Synnott, S. P. 1991, J. Property Res., 3, 30604 [Google Scholar]
- Park, R. S., Folkner, W. M., Williams, J. G., & Boggs, D. H. 2021, AJ, 161, 105 [NASA ADS] [CrossRef] [Google Scholar]
- Parrish, N., & Stone, O. 1892, AJ, 12, 90 [NASA ADS] [CrossRef] [Google Scholar]
- Perrine, C. D. 1903, Lick Observ. Bull., 2, 70 [Google Scholar]
- Perrotin, H. J. 1887, Bull. Astron. Ser. I, 4, 339 [Google Scholar]
- Prockter, L. M., Mitchell, K. L., & Howett, C. J. A. 2019, Astrobiology, 19, 1 [Google Scholar]
- Qiao, R., Zhang, H., Dourneau, G., et al. 2014, MNRAS, 440, 3749 [CrossRef] [Google Scholar]
- ROG 1899, MNRAS, 59, 501 [Google Scholar]
- ROG 1900, MNRAS, 61, 9 [Google Scholar]
- ROG 1903, MNRAS, 61, 503 [Google Scholar]
- ROG 1904, MNRAS, 64, 835 [Google Scholar]
- ROG 1905, MNRAS, 66, 10 [Google Scholar]
- ROG 1906, MNRAS, 67, 91 [Google Scholar]
- ROG 1907, MNRAS, 68, 33 [Google Scholar]
- ROG 1908, MNRAS, 68, 586 [Google Scholar]
- ROG 1913, MNRAS, 73, 155 [Google Scholar]
- Rümker, C. 1849, MNRAS, 9, 221 [Google Scholar]
- Schaeberle, J. 1895, AJ, 15, 25 [NASA ADS] [CrossRef] [Google Scholar]
- Schaeberle, J. 1897, AJ, 17, 62 [NASA ADS] [CrossRef] [Google Scholar]
- Shapiro, S. S., & Wilk, M. B. 1965, Biometrika, 52, 591 [Google Scholar]
- Showalter, M. R., de Pater, I., Lissauer, J. J., & French, R. S. 2019, Nature, 566, 350 [NASA ADS] [CrossRef] [Google Scholar]
- Smith, B. A., Soderblom, L. A., Banfield, D., et al. 1989, Science, 246, 1422 [NASA ADS] [CrossRef] [Google Scholar]
- Tang, K., Song, Y. Z., Shen, K. X., et al. 2020, A&A, 641, A108 [NASA ADS] [CrossRef] [EDP Sciences] [Google Scholar]
- Tian, B.-Y., Wang, D. Y., Zhang, X. Y., et al. 2021, Journal of Astronautics, 42, 284 [Google Scholar]
- TMO 2014, CCD Astrometric Measurements from Table Mountain Observatory [Google Scholar]
- Tyler, G. L., Sweetnam, D. N., Anderson, J. D., et al. 1989, Sci., 246, 1466 [NASA ADS] [CrossRef] [Google Scholar]
- USNO 1911, Publications of the U.S. Naval Observatory Second Series, 6, 3 [Google Scholar]
- USNO 2013, CCD Astrometric Measurements from US Naval Observa-tory/Flagstaff [Google Scholar]
- USNO 2014, CCD Astrometric Measurements from US Naval Observatory/Flagstaff [Google Scholar]
- Veiga, C., & Martins, R. V. 1996, Astron. Astrophys. Suppl. Ser., 120, 107 [NASA ADS] [CrossRef] [EDP Sciences] [Google Scholar]
- Veiga, C., & Martins, R. V. 1998, Astron. Astrophys. Suppl. Ser., 131, 291 [NASA ADS] [CrossRef] [EDP Sciences] [Google Scholar]
- Veiga, C., Vieira Martins, R., Le Guyader, C., & Assafin, M. 1996, A&AS, 115, 319 [NASA ADS] [Google Scholar]
- Walker, R., & Harrington, R. 1988, AJ, 95, 1562 [NASA ADS] [CrossRef] [Google Scholar]
- Walker, R., Christy, J., & Harrington, R. 1978, AJ, 83, 838 [NASA ADS] [CrossRef] [Google Scholar]
- Wang, N., Peng, Q., Peng, H., et al. 2017, MNRAS, 468, 1415 [NASA ADS] [CrossRef] [Google Scholar]
- Winlock, J., & Pickering, E. C. 1888, Annals of Harvard College Observatory, 13, 188 [NASA ADS] [Google Scholar]
- Wirtz, C. 1905, Astron. Nachr., 169, 33 [NASA ADS] [CrossRef] [Google Scholar]
- Wu, Yu, D., & Huang, J. 2019, SCIENTIA SINICA Informationis, 49, 1 [Google Scholar]
- Yan, J., Yang, X., Ye, M., et al. 2017, Astrophys. Space Sci., 362, 1 [CrossRef] [Google Scholar]
- Yan, J., Liu, S., Yang, X., et al. 2019, Astrophys. Space Sci., 364, 58 [NASA ADS] [CrossRef] [Google Scholar]
- Yan, D., Qiao, R., Cheng, X., & Yu, Y. 2020, Icarus, 343, 113662 [NASA ADS] [CrossRef] [Google Scholar]
- Yan, D., Qiao, R., Zhang, H., Yu, Y., & Tang, K. 2022, Icarus, 372, 114728 [NASA ADS] [CrossRef] [Google Scholar]
- Yizhakevych, O. M., Andruk, V. M. P. L. K. 2016, Odessa Astron. Publ., 29, 155 [Google Scholar]
- Young, C. 1888, AJ, 8, 14 [NASA ADS] [CrossRef] [Google Scholar]
- Yu, Y., C. X. Q. R. C. Y. D. L. H., & K. T. 2019, Planet. Space Sci., 165, 205 [NASA ADS] [CrossRef] [Google Scholar]
- Yuan, Y., Li, F., Fu, Y., & Chen, J. 2021a, A&A, 654, A66 [NASA ADS] [CrossRef] [EDP Sciences] [Google Scholar]
- Yuan, Y., Li, F., Fu, Y., & Ren, S. 2021b, A&A, 645, A48 [NASA ADS] [CrossRef] [EDP Sciences] [Google Scholar]
- Zhang, H., Qiao, R., Yu, Y., Yan, D., & Tang, K. 2021, AJ, 161, 237 [NASA ADS] [CrossRef] [Google Scholar]
- Zhang, H., Yu, Y., Yan, D., Tang, K., & Qiao, R. 2022, Res. Astron. Astrophys., 22, 035006 [CrossRef] [Google Scholar]
All Tables
All Figures
|
Fig. 1 Differences between the positions from NEP081 and from NEP097. The differences are shown in the orbit radial (R), transverse (T), and out-of-plane (N) directions. These two Triton ephemerides have different orbital models. The model for NEP081 assumes the inner satellites are massless and do not gravitationally attract Triton. The model for NEP097 assumes the orbit of Triton is influenced by the perturbations from the inner regular satellites of Neptune. As NEP081 only provides ephemeris data between 1900 and 2100, we have made the comparison within this time span. |
| In the text | |
|
Fig. 2 Differences between the new ephemeris and NEP081 and NEP097. The differences are shown in the orbit radial (R), transverse (T), and out-of-plane (N) directions. As NEP081 provides ephemeris data only after 1900, the comparison is from 1900 to 2050. |
| In the text | |
|
Fig. 3 Weight residuals for the integrated orbit fit for all observation types from 1847 to 2020. The weights were assigned in accordance with the RMS of post-fit residuals shown under RMS1 and RMS2 in Table 1. |
| In the text | |
|
Fig. 4 Correlation coefficients between the dynamical parameters |
| In the text | |
|
Fig. 5 First-order partial derivatives of the astronomic observations with respect to the GMs of the Neptunian system, J2, and J4. |
| In the text | |
|
Fig. 6 Distributions of pole parameters in MC analysis. To better show the distribution of values, we expanded the value of ∆δ0 by a factor of ten. |
| In the text | |
|
Fig. 7 Distance between Triton’s possible integrated ephemerides and the nominal integrated ephemeris. These possible Triton ephemerides have different pole parameters. We made the comparison at two moments: initial time and at the end of integration time. The different colors represent 100 cases in MC analysis. |
| In the text | |
|
Fig. 8 Distributions of the GMs, J2, and J4 deviations between the possible solutions and the nominal solution. To better show the distribution of values, we expanded the value of ∆ J2 and ∆ J4. |
| In the text | |
Current usage metrics show cumulative count of Article Views (full-text article views including HTML views, PDF and ePub downloads, according to the available data) and Abstracts Views on Vision4Press platform.
Data correspond to usage on the plateform after 2015. The current usage metrics is available 48-96 hours after online publication and is updated daily on week days.
Initial download of the metrics may take a while.