| Issue |
A&A
Volume 657, January 2022
|
|
|---|---|---|
| Article Number | A134 | |
| Number of page(s) | 6 | |
| Section | Planets and planetary systems | |
| DOI | https://doi.org/10.1051/0004-6361/202141598 | |
| Published online | 21 January 2022 | |
Neptune’s ring arcs from VLT/SPHERE-IRDIS near-infrared observations★
1
CRAL, UMR 5574, CNRS, Université de Lyon, Ecole Normale Supérieure de Lyon, 46 allée d’Italie, 69364
Lyon Cedex 07, France
e-mail: This email address is being protected from spambots. You need JavaScript enabled to view it.
; This email address is being protected from spambots. You need JavaScript enabled to view it.
2
naXys, University of Namur,
8 Rempart de la Vierge,
Namur
5000,
Belgium
3
Université de Lille, Observatoire de Lille,
1 impasse de l’Observatoire,
59000
Lille,
France
4
IMCCE, Observatoire de Paris, CNRS UMR 8028,
77 avenue Denfert Rochereau,
75014
Paris,
France
5
CRAL, UMR 5574, CNRS, Université de Lyon, Ecole Normale Supérieure de Lyon,
46 allée d’Italie,
69364
Lyon Cedex 07, France
6
Université de la Côte d’Azur, Observatoire de la Côte d’Azur, CNRS, Laboratoire Lagrange, Nice,
France
7
Univ. Grenoble Alpes, CNRS, IPAG,
38000
Grenoble,
France
8
University of Toronto Scarborough,
Toronto,
ON
M1C 1A4,
Canada
Received:
20
June
2021
Accepted:
15
October
2021
Abstract
Context. Neptune’s incomplete ring arcs have been stable since their discovery in 1984 by stellar occultation. Although these structures should be destroyed within a few months through differential Keplerian motion, imaging data over the past couple of decades have shown that these structures remain stable.
Aims. We present the first SPHERE near-infrared observations of Neptune’s ring arcs taken at 2.2 μm (broadband Ks) with the IRDIS camera at the Very Large Telescope (VLT) in August 2016.
Methods. The images were aligned using the ephemerides of the satellite Proteus and were suitably co-added to enhance ring and satellite signals.
Results. We analyse high-angular-resolution near-infrared images of Neptune’s ring arcs obtained in 2016 at the ESO VLT-UT3 with the adaptive-optics-fed camera SPHERE-IRDIS. We derive accurate mean motion values for the arcs and the nearby satellite Galatea. The trailing arcs Fraternité and Égalité have been stable since they were last observed in 2007. Furthermore, we confirm the fading away of the leading arcs Courage and Liberté. Finally, we confirm the mismatch between the arcs’ position and the 42:43 inclined and eccentric corotation resonances with Galatea, thus demonstrating that no 42:43 corotation model works to explain the azimuthal confinement of the arcs’ materiel.
Key words: planets and satellites: individual: Neptune / planets and satellites: rings / celestial mechanics / techniques: photometric
This study is based on observations made with ESO telescopes at the La Silla Paranal Observatory, Chile, under programme SPHERE ID - 097.C- 0336 (A).
© D. Souami et al. 2022
 Open Access article, published by EDP Sciences, under the terms of the Creative Commons Attribution License (https://creativecommons.org/licenses/by/4.0), which permits unrestricted use, distribution, and reproduction in any medium, provided the original work is properly cited.
1 Introduction
A stellar occultation campaign on July 22, 1984, yielded the first conclusive evidence of an incomplete ring-like structure around Neptune, inside the classical Roche limit, assuming a density of 1 for the ring material (Roques et al. 1984; Sicardy et al. 1985; Hubbard et al. 1986; Covault et al. 1986). A summary of the discovery of the arcs is given in Nicholson et al. (1990); the authors compiled the results of five occultations (between April 18, 1984, and August 20, 1985) as well as the 1989 Voyager 2 data, confirming three distinct features. Voyager 2 data revealed that the arcs are longitudinally confined over a 40° azimuthal range. They are embedded in the much fainter continuous Adams ring around Neptune (Smith et al. 1989), which is the outermost ring of the Neptunian system.
These incomplete rings, which would be expected to scatter in a few months through differential Keplerian motion, have nevertheless been stable since their discovery in 1984 (Hubbard et al. 1986). The azimuthal confinement of the arc system (Goldreich et al. 1986; Porco 1991) was thought to be a consequence of the arcs being within a 42:43 corotation inclination resonance (CIR) forced by Galatea. However, observations in 1998 (Dumas et al. 1999; Sicardy et al. 1999) showed a slight mismatch between the observed arc mean motion and its expected value in the framework of the 42:43 CIR model.
Furthermore, adaptive optics (AO) data obtained with the Keck telescope in 2002 and 2003 (de Pater et al. 2005) as well as Very Large Telescope (VLT) UT3 NACO data from 2007 (Renner et al. 2014) showed two persisting trailing arcs. They also showed that the brightness and longitudes of the arcs (Fraternité, Égalité, Liberté, and Courage) have significantly changed since the observations by Voyager (de Pater et al. 2005; De Pater et al. 2018; Renner et al. 2014). Several theoretical models have addressed the question of the arcs’ stability and the aforementioned mean motion mismatch. For example, Namouni & Porco (2002) have shown that the 42:43 corotation eccentricity resonance (CER) could match the current arcs’ semi-major axis and stabilise the system if the arcs contain a small fraction of Galatea’s mass (mG). Assuming a mass mG = 2.1 × 10²¹g for Galatea,the model, which is very sensitive to the uncertainty in Galatea’s eccentricity (mG), gave a ring mass of ~ 0.23 mG (0.002 mG, resp.) for mG = 10−4 (mG = 10−6, resp.).
Hereafter, we adopt the 42:43 nomenclature for the sake of simplicity. While the CER is a first-order resonance (a true 42:43), the CIR is a second-order resonance (84:86)1.
Alternatively, multiple small co-orbital satellites in a stable stationary configuration that generalises the Lagrangian points (Renner & Sicardy 2004; Renner et al. 2014) are able to efficiently confine the dusty arc material, provided the right azimuthal spacings and masses of those co-orbital objects are chosen. In the framework of that model, Giuliatti Winter et al. (2020) investigated the arc orbital evolution under the effect of solar radiation.
Showalter et al. (2017) presented a possible three-body resonance mechanism capable of confining ring material within the observed corotation sites. This scenario constrains the orbital semi-major axis of the arcs to fall within ~10 m of a three-body mean motion resonance, which involves the two nearby inner satellites, Galatea and Larissa.
Finally, Showalter et al. (2019) recently discovered a seventh inner moon of Neptune, Hippocamp, proving that the Neptunian system has not fully revealed itself. Furthermore, in the context of the possible Trident mission (pre-selected in NASA’s Discovery Program), which would target the Neptune-Triton system, as well as a possible future ESA-NASA mission towards the Uranian and Neptunian systems, the next couple of decades could revolutionise our understanding of these systems.
In this paper we report on astro-photometric measurements of the arcs that were obtained at the VLT-UT3 with the Spectro-Polarimetric High-contrast Exoplanet REsearch (SPHERE) InfraRed Dual-band Imager and Spectrograph (IRDIS) instrument fed by its extreme AO system (called SAXO) obtained on August 23, 2016. The IRDIS classical imaging mode has also been used for several asteroid studies, leading to shape reconstruction (Viikinkoski et al. 2015; Marsset et al. 2017). These studies largely benefit from the high resolution and high Strehl, which provide much more detailed images than previous AO-corrected images from other instruments.
This paper is organised as follows. In Sect. 2 we present our observational data and the methods used for the analysis. Section 3 pertains to the photometric profiles of the arcs and the mean motion of the arcs and the satellite Galatea. Finally, we draw our final conclusions in Sect. 4.
2 Observations
We used the high-angular-resolution AO SPHERE instrument installed on the VLT-UT3 at the European Southern Observatory (ESO) with IRDIS (Dohlen et al. 2008; Beuzit et al. 2019) to image the Neptunian system (ring arcs and moons) on August 23, 2016. The IRDIS classical imaging mode (Langlois et al. 2010) provides simultaneous images recorded in the same broadband filter on two distinct detector areas. The data were acquired using this classical mode of SPHERE in the Ks broadband (BB-Ks) filter centred at 2.2 μm, which corresponds to a strong absorption in the methane spectrum, hence reducing the otherwise overwhelming scattered light from Neptune’s atmosphere.
In BB-Ks, the instrument exhibits a fairly high thermal background from thermal emission, reaching 60–200 photon s−1 pixel−1 (Beuzit et al. 2019). This renders nearly impossible the classical reduction procedures used to identify faint objects, such as small Neptunian satellites or ring and arc features.
The IRDIS dual-band imager in classical imaging mode provides a field of view of 11″ × 12.5″ with a pixel size of (12.255 ± 0.009) mas pixel−1 on the sky (Maire et al. 2016). This corresponds to ~ 257 km pixel−1 at Neptune’s geocentric distance of 28.959 AU (see Table 1).
We acquired field-stabilised data between 03:09:30.9281 and 07:58:36.2025 UT on August 8, 2016. This acquisition mode uses a specific de-rotator rotation law to maintain the same field of view orientation during the observing sequence.
Figure 1 shows the details of the atmospheric conditions (seeing, airmass, and coherence time, τ0) during the entire observational run, together with the time window of frames selected for the photometric analysis (green shaded area). Although the seeing remains fairly stable throughout the observation, about 27.4% of our data (57 frames) were acquired at times associated with non-negligible atmospheric turbulence and thus not used for our photometric analysis. The threshold defined by ESO as associated with fast wind and/or fast turbulence conditions (i.e. turbulence evolving on timescales smaller than 3.5 ms) is defined by low coherence times (i.e. τ ≤ 3.5 ms). Due to these constraints, combined with the instability of the AO tracking (see Sect. 2.2 for details), the highest quality datathat we selected and retained for the photometric analysis were obtained at the smallest airmass (< 1.1).
Circumstances of observation.
2.1 Data reduction
We used the SPHERE pipeline package to correct for flat field, bad pixels, and thermal background due to instrument and sky. Because the thermal background varies with the instrument temperature and with the sky background,we selected background calibration images acquired using the same integration time and the same filter (BB-Ks of 300 nm width) as the science frames but acquired at a different time so that they match the conditions of the observations better. Some uncorrected background leaks persist in our final K images due to thermal background fluctuations. The astrometrisation (centring, correction for anamorphism, scale, and true north) of the final data cubes were corrected following the SPHERE Data Center procedures (Delorme et al. 2017). We also corrected the true-north offset of the images by rotating the images by the angle Pcor= (−1.57 ± 0.08) deg (Maire et al. 2016), where Pcor is the position angle of the celestial north direction with respect to the frame columns and the position of Neptune’s centre.
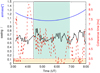 |
Fig. 1 Observing conditions (airmass, seeing, and coherence time) at Paranal during the observation run (between 03:09:30.9281 and 07:58:36.2025 UT on August 23, 2016). The large fluctuations in coherence time, τ0, of atmospheric turbulence show that some images cannot be used, because of small τ0 values that are associated with fast atmospheric turbulence (the shaded light red horizontal band for which τ0 < 3.5 ms). The green shaded area represents the time window from which the final images used in our analysis were extracted (see text for explanation). These images correspond to the lowest airmass observing window. |
2.2 Astro-photometric analysis of the data
Using the IRDIS HAWAII-2-RG near-infrared detector, we initially acquired 208 exposures of 64 s of exposure time each. However, because of the aforementioned thermal background, passing clouds, and varying winds, only the best 68 images from the right panel were deemed to be of high enough signal-to-noise ratio (S/N) and used for our analysis (see Table 1).
In Renner et al. (2014), we were able to refine the determination of the pixel scale and the orientation on sky by comparing the positions of Triton and Proteus to their expected relative positions. In this paper, given the fact that Proteus is the only satellite with sufficiently accurate astrometry and ephemerides, we had to operate under the following assumptions: (i) perfect ephemerides of the satellite Proteus, which were used to retrieve Neptune’s centre position, and (ii) that the scale and orientation provided by the SPHERE-IRDIS consortium are correct. The instability of the AO correction due to the observation of an object as extended as Neptune (2.4″ in diameter) used as the guide star resulted in image motion that required a realignment. Such realignment was obtained using Proteus’s ephemerides (Jacobson 2009) because the photo-centre of Neptune cannot be accurately determined (due to its non-uniformity and its extended nature). To centre the images, we first determined an approximate position (photo-centre) of Proteus on each image. From the ephemerides and the measured position of the photo-centre, we were able to retrieve a ‘first-order’ position for Neptune’s centre. We then iterated the analysis on the first-order-centred images, from which we subtracted the median of the first centred cube files in which Neptune only is stationary, thus refining our determination of Proteus’s photo-centre along its orbit, and therefore the position of Neptune’s centre. This last step was repeated on this new cube of centred images as this process allows the removal of the diffuse scattered light around Neptune, thus improving the determination of the satellite’s photo-centre. Two iterations of the procedures were indispensable for achieving a sub-pixel accuracy for the positions of the satellite and Neptune. Examples of an individual frame as well as a final stack of the centred clean images are presented in Fig. 2.
The individual images were then projected onto Neptune’s equatorial plane. The single projected frames were rotated, taking the respective orbital motion into account, and co-added to increase the signal from the ring arcs or a given satellite.
3 Results
3.1 Photometry
In what follows, we use only the best 68 selected projected frames, taken between 04:24:50.5202 and 06:43:23.0627 on August 23, 2016, UT. These were co-added after correction for the arcs’ mean motion, 820.11213 deg day−1 (Renner et al. 2014), to produce the panel in Fig. 3a (total exposure time of 72 min and 32 s).
Unlike the SPHERE data, for which the field is depleted of stars, the 2007 NACO data (Renner et al. 2014) included a reference star that could be used for photometric calibration. We had to adapt to this additional constraint.
Using the same subset of SPHERE images with a sufficiently good S/N for both Proteus and Galatea, we de-rotated these images at the respective mean motion values: (320.765625 ± 0.000001) deg day−1 for Proteus and (839.661311 ± 0.000005) deg day−1 for Galatea (Showalter et al. 2019). On these images, we measured the fluxes of the satellites using classical aperture photometry. We then compared the ratio of fluxes (Proteus/Galatea) for the NACO data (Renner et al. 2014) to that of the SPHERE data used in this paper and found ratios of 0.12 ± 0.01 and 0.13 ± 0.01, respectively. The flux ratio of Proteus to Galatea is thus unchanged (at the 1σ error level).
Similarly to what was done in Renner et al. (2014), the brightness longitudinal profiles are given in equivalent width, that is, the width of a perfect Lambert diffuser that would reflect sunlight at the distance of Neptune. Following earlier studies of Neptune’s rings (Smith et al. 1989; Porco et al. 1995), the equivalent width is defined by E(λ) = μ∫ I(λ)∕F(λ)dr, where I(λ) denotes the observed flux reflected from the arcs, πF(λ) the incident solar flux, λ the wavelength at which observations were done, and μ the cosine of the emission angle with respect to the ring-plane normal.
For our photometric analysis of the arcs’ profile, we proceeded as follows. First, we obtained the profiles of the arcs in analogue-to-digital units (ADUs) by subtracting the sky background and Neptune’s scattered light from the arcs’ signal. To perform this operation, we integrated the ring region in the radial direction over 13 pixels. We selected circular annuli on both sides of the ring arcs, summed the pixels in the radial direction, and fitted a two-degree polynomial as a function of the longitude. The radial width of these inner and outer circular rings are ~11 and 13 pixels, respectively. The average of the two polynomial fits was then subtracted from the arcs’ flux.
Second, using the same 68 individual projected frames as in Fig. 2, which we rotated at Proteus’s mean motion, we performed aperture photometry and extracted the flux in ADU for the satellite. Third, we then normalised the rings’ flux profile obtained in the first step by the flux of Proteus obtained in the second step. Fourth, we repeated the first three steps on the NACO 2007 data taken at 2.2 μm (Ks band) (Renner et al. 2014).
Fifth, we used the normalised (NACO 2007) ADU flux profile of the rings obtained in the fourth step and the equivalent width profile for these same rings (Renner et al. 2014) to derive the conversion factor between the normalised flux and the profile in equivalent width. We then applied this factor to the 2016 SPHERE data. This is permitted since both the NACO and SPHERE data were acquired in Ks-BB at 2.2 μm and under the assumption of a fixed magnitude for Proteus (see above). This approach is justified by the absence of a reference (calibration) star in the 2016 SPHERE data.
The equivalent width profiles of the ring arcs are presented in Fig. 3b. We detected the arcs Fraternité and Égalité, with flux densities and longitudinal extensions similar to those of the previous VLT-NACO (Renner et al. 2014) and Keck observations (de Pater et al. 2005).
The trailing arcs Fraternité and Égalité are clearly separated in our data (see Fig. 3a), which was not the case in the NACO data (Renner et al. 2014). Despite the high thermal noise, we were able to draw conclusions on the stability of the trailing arcs Fraternité and Égalité and to extract equivalent width profiles. Finally, these new data confirm that the leading arcs Courage and Liberté have faded away, in line with previous studies that had been leaning in that direction (Dumas et al. 1999; de Pater et al. 2005). Accounting for the geocentric distance given in Table 1, we derived the equivalent width of the arcs Fraternité and Égalité at the epoch of observation at the 1σ uncertainty level and find that EFr = (84 ± 18) m and EEg = (76 ± 18) m, respectively.
For comparison, Renner et al. (2014) and de Pater et al. (2005) found EFr = (71 ± 10) m and ~65 m, respectively. In Renner et al. (2014), we reported that Égalité was about ~20% fainter thanFraternité from our 2007 VLT-NACO data (keeping the pollution by Galatea of the arcs in mind). On the other hand, de Pater et al. (2005) report that Égalité was ~17% brighter than Fraternité (~ 3σ) in their 2002 Keck II data, while its intensity had decreased to ~7% below that of Fraternité (~2σ) in 2003.
To summarise, given the uncertainties on the equivalent width measurements, the arcs Fraternité and Égalité appear to be stable when compared to previous studies (Dumas et al. 1999; de Pater et al. 2005; Renner et al. 2014).
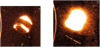 |
Fig. 2 Left: single 64-second exposure of Neptune in the BB-Ks band (2.182 μm), 2016-08-23T05:12:52.2635 UT August 23, 2016, revealing the satellites Proteus (P), Galatea (G), and Larissa (L). The frame is 5.39 × 5.92 arcsec2 wide. The point source is due to a bad pixel cluster that is difficult to properly interpolate. Right: image of Neptune’s system obtained by co-adding 68 individual frames of the August 23, 2016, data (72 min and 32 s of total exposure time, between 04:24:50.5202 and 06:43:23.0627 UT). The frame is 6.99 × 6.99 arcsec2 wide. We can see Proteus (P) and Larissa (L) along their respective orbits during this time interval. We can also see the trail of Galatea (G) and the arcs, which evolve along the much fainter Adams ring. The bright arc on the left is due to thermal electronic noise. |
3.2 Mean motions
We improved the average mean motion of the satellite Galatea: (i) At epoch 2016-08-23T04:25:22.5202 UT, we derive the satellite’s longitude L = 259°.58 ± 0°.30, measured in the ring plane from the J2000.0 ascending node of Neptune’s equatorial plane, (ii) using the reference longitudes measured by Voyager (Owen et al. 1991) at epoch JD 2447757.0 (i.e. August 18, 1989, at 12 h) at Neptune, we derive the average mean motion of Galatea, nG = (839.66134 ± 0.00003) deg day−1. This value is in agreement with that given in Showalter et al. (2019), (839.661311 ± 0.000005) deg day−1.
Furthermore, from the stacked image (Fig. 3a) with respect to the reference frame (see Table 1), we derive a longitude LFr = (217.43 ± 0.30) deg for the trailing arc Fraternité at this same reference epoch. We used the position of the middle of this arc measured from Voyager data (251.88 deg at epoch JD 2447757.0, i.e. August 18, 1989, 12h UT) as given in Porco et al. (1995) and derive the following average mean motion for the arcs (Fraternité and Égalité): narcs = (820.11178 ± 0.00003) deg day−1, which is consistent with, yet more accurate than, previous measurements (‘solution 2’ of Nicholson et al. 1995 and de Pater et al. 2005), 820.1118 ± 0.0001 deg day−1. We used our new measurement to compare narcs with the mean motion of the 42:43 CIR, initially thought to confine dust within the ring to form stable arcs (Goldreich et al. 1986; Porco 1991).
The 42:43 CIR with Galatea creates 86 equally spaced corotation sites around Neptune, with a mean motion given by 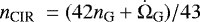 , where
  is Galatea’s nodal precession rate. Using
 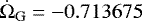 deg day−1 (Showalter et al. 2019), we find nCIR = 820.11773 ± 0.00003 deg day−1. This value of nCIR is similar to previous mean motion measurements (Nicholson et al. 1995; Sicardy et al. 1999; Dumas et al. 1999, 2002; de Pater et al. 2005; Renner et al. 2014), showing that the arcs are not at the location of the 42:43 CIR with Galatea. This mean motion drift translates into a mismatch in semi-major axis of Δa = (305 ± 2) m (see Table 2). This mismatch is consistent with, yet more accurate than, those reported in Sicardy et al. (1999) and Renner et al. (2014), the half width of the CIR being (250 ± 100) m (Renner et al. 2014).
Furthermore, we investigated the 42:43 CER with Galatea. This resonance is defined as follows:  , where
  is Galatea’s apsidal precession rate. With
 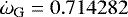 deg day−1 (Showalter et al. 2019), we find nCER = 820.15094 ± 0.00003 deg day−1.
For both the 42:43 CIR and CER, we give in Table 2 the corresponding mismatch values in semi-major axis, as well as the associated difference for the arcs’ longitude (ΔL) over ~27.01364 yr (between the 1989 Voyager and 2016 VLT SPHERE-IRDIS data). It should be noted that these values are large and far from what we observe.
Figure 4 illustrates a graphic comparison of the semi-major axis of the arcs, as derived from the mean motion, as well the CER and CIR radius values derived in this work following the same approach as Foryta & Sicardy (1996). We used the parameters of Galatea and Neptune given in Table 3. In particular, Fig. 4 clearly depicts the widths (Δ a) of each of the CIR and CER resonances (i.e. the interval in the semi-major axis where particles would be trapped by each of these resonances).
From this analysis of the mismatch (Δa) and the resulting drifts in longitude (ΔL), we conclude that neither the CIR nor the CER 42:43 (Namouni & Porco 2002) corotation models can explain the confinement of the arcs at their current locations. The only valid model, so far, to explain the azimuthal spacing of the arcs is the model based on small co-orbital satellites (Renner et al. 2014).
Finally, we tested the three-body mean motion resonance hypothesis (Showalter et al. 2017) of argument (35 nG − 39 narcs + 4 nL), which involves the satellites Galatea and Larissa. We used the mean motions for Galatea and the arcs derived in the work as well as Larissa’s mean motion, nL = (649.054085 ± 0.000004) deg day−1 (Showalter et al. 2019); we obtain a value of 0.00382 deg day−1. Further work is needed to confirm whether or not this three-body resonance is able to confine dust particles in corotation sites with spacings compatible with the observations.
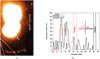 |
Fig. 3 (a) 68 projected and co-added images of Neptune’s equatorial plane, revealing material along the arcs Fraternité and Égalité, as well as the satellites Proteus (P) and Galatea (G). The frame is 7.1 × 10.7 arcsec2 wide. (b) Equivalent width of the arcs (Fraternité and Égalité) vs. longitude extracted from Fig. 3b, at an angular resolution of 2°. The X-axis origin is the longitude LFr of the centre of the Fraternité arc measured from the J2000.0 ascending node, where LFr = 217.43 deg, at the reference epoch (see Table 1). |
Investigating the 42:43 CIR and the 42:43 CER corotation models with Galatea.
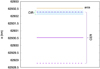 |
Fig. 4 Graphical illustration of the arcs’ semi-major axis, as well as the radii and widths of the CIR and CER motion resonances 42:43 with Galatea. The orange line depicts the geometrical orbital radius of the arcs, with uncertainties (in black dotted lines) smaller than the thickness of the orange line. The CIR and CER locations and widths are represented in blue and purple, respectively. They represent the interval in the semi-major axis where particles would be trapped by these resonances. This figure clearly shows the mismatch between the 42:43 CIR and the CER with Galatea and the arc’s position. The associated differences in longitude (Δ L) in Table 2 support this conclusion. |
Parameters used to explore the validity of the 42:43 CER and CIR models: Neptune’s physical properties from Jacobson (2009) and the orbital inclination and eccentricity of Galatea derived by Showalter et al. (2019).
4 Conclusions
We have analysed high-angular-resolution near-infrared images of Neptune’s ring arcs obtained in 2016 at the ESO VLT-UT3 with the AO camera SPHERE-IRDIS.
We detected the trailing arcs Fraternité and Égalité as well as the satellite Galatea, for which we derived more accurate mean motion values. From the accurate determination of the mean motions, we confirm the mismatch between the arcs’ position and the location of the 42:43 CIR and the CER with Galatea, thus showing that no 42:43 corotation model can explain the persistence of Neptune’s incomplete ring arcs.
Moreover, our photometric analysis of the arcs confirms that the leading arcs, Courage and Liberté, have faded away, while the trailing arcs, Fraternité and Égalité, have been persistent and stable since their discovery.
Regular imaging data, in particular with Galatea far from the arcs system to avoid light contamination, are needed to follow the global time evolution of the system and to propose a more global model for the arcs’ confinement that takes into account the disappearance of the two leading arcs, Liberté and Courage.
Acknowledgements
This work has made use of the SPHERE Data Centre, jointly operated by OSUG/IPAG (Grenoble), PYTHEAS/LAM/CeSAM (Marseille), OCA/Lagrange (Nice), Observatoire de Paris/LESIA (Paris), and Observatoire de Lyon (OSUL/CRAL), and supported by a grant from Labex OSUG@2020 (Investissements d’avenir – ANR10 LABX56). This work was funded by the European Research Council under the European Community’s H2020 (2014-2021/ERC Grant Agreement No. 669416). We thank the reviewer for their thorough revision of our paper and constructive comments that significantly improve the quality of this work.
References
- Beuzit, J. L., Vigan, A., Mouillet, D., et al. 2019, A&A, 631, A155 [NASA ADS] [CrossRef] [EDP Sciences] [Google Scholar]
- Covault, C. E., Glass, I. S., French, R. G., & Elliot, J. L. 1986, Icarus, 67, 126 [NASA ADS] [CrossRef] [Google Scholar]
- de Pater, I., Gibbard, S. G., Chiang, E., et al. 2005, Icarus, 174, 263 [NASA ADS] [CrossRef] [Google Scholar]
- De Pater, I., Renner, S., Showalter, M. R., & Sicardy, B. 2018, The Rings of Neptune, eds. M. S. Tiscareno, & C. D. Murray (USA: NASA), 112 [Google Scholar]
- Delorme, P., Meunier, N., Albert, D., et al. 2017, in SF2A-2017: Proceedings of the Annual meeting of the French Society of Astronomy and Astrophysics, eds. C. Reylé, P. Di Matteo, F. Herpin, et al. [Google Scholar]
- Dohlen, K., Langlois, M., Saisse, M., et al. 2008, SPIE Conf. Ser., 7014, 70143L [Google Scholar]
- Dumas, C., Terrile, R. J., Smith, B. A., Schneider, G., & Becklin, E. E. 1999, Nature, 400, 733 [NASA ADS] [CrossRef] [Google Scholar]
- Dumas, C., Terrile, R. J., Smith, B. A., & Schneider, G. 2002, AJ, 123, 1776 [NASA ADS] [CrossRef] [Google Scholar]
- Foryta, D. W., & Sicardy, B. 1996, Icarus, 123, 129 [NASA ADS] [CrossRef] [Google Scholar]
- Giuliatti Winter, S. M., Madeira, G., & Sfair, R. 2020, MNRAS, 496, 590 [NASA ADS] [CrossRef] [Google Scholar]
- Goldreich, P., Tremaine, S., & Borderies, N. 1986, AJ, 92, 490 [NASA ADS] [CrossRef] [Google Scholar]
- Hubbard, W. B., Brahic, A., Sicardy, B., et al. 1986, Nature, 319, 636 [NASA ADS] [CrossRef] [Google Scholar]
- Jacobson, R. A. 2009, AJ, 137, 4322 [Google Scholar]
- Langlois, M., Vigan, A., Dohlen, K., et al. 2010, SPIE Conf. Ser., 7735, 773512 [NASA ADS] [Google Scholar]
- Maire, A.-L., Langlois, M., Dohlen, K., et al. 2016, SPIE Conf. Ser., 9908, 990834 [Google Scholar]
- Marsset, M., Carry, B., Dumas, C., et al. 2017, A&A, 604, A64 [NASA ADS] [CrossRef] [EDP Sciences] [Google Scholar]
- Namouni, F., & Porco, C. 2002, Nature, 417, 45 [NASA ADS] [CrossRef] [Google Scholar]
- Nicholson, P. D., Cooke, M. L., Matthews, K., Elias, J. H., & Gilmore, G. 1990, Icarus, 87, 1 [NASA ADS] [CrossRef] [Google Scholar]
- Nicholson, P. D., Mosqueira, I., & Matthews, K. 1995, Icarus, 113, 295 [NASA ADS] [CrossRef] [Google Scholar]
- Owen, W. M., Vaughan, R. M., & Synnott, S. P. 1991, AJ, 101, 1511 [NASA ADS] [CrossRef] [Google Scholar]
- Porco, C. C. 1991, Science, 253, 995 [NASA ADS] [CrossRef] [Google Scholar]
- Porco, C. C., Nicholson, P. D., Cuzzi, J. N., Lissauer, J. J., & Esposito, L. W. 1995, in Neptune and Triton (Berlin: Springer), 703 [Google Scholar]
- Renner, S., & Sicardy, B. 2004, Celest. Mech. Dyn. Astron., 88, 397 [NASA ADS] [CrossRef] [Google Scholar]
- Renner, S., Sicardy, B., Souami, D., Carry, B., & Dumas, C. 2014, A&A, 563, A133 [NASA ADS] [CrossRef] [EDP Sciences] [Google Scholar]
- Roques, F., Sicardy, B., Bouchet, P., et al. 1984, BAAS, 16, 1027 [NASA ADS] [Google Scholar]
- Showalter, M., Lissauer, J. J., de Pater, I., & French, R. S. 2017, AAS/Div. Planet. Sci. Meeting Abs., 49, 104.01 [Google Scholar]
- Showalter, M. R., de Pater, I., Lissauer, J. J., & French, R. S. 2019, Nature, 566, 350 [NASA ADS] [CrossRef] [Google Scholar]
- Sicardy, B., Hubbard, W. B., Brahic, A., & Roques, F. 1985, BAAS, 17, 923 [NASA ADS] [Google Scholar]
- Sicardy, B., Roddier, F., Roddier, C., et al. 1999, Nature, 400, 731 [NASA ADS] [CrossRef] [Google Scholar]
- Smith, B. A., Soderblom, L. A., Banfield, D., et al. 1989, Science, 246, 1422 [NASA ADS] [CrossRef] [Google Scholar]
- Viikinkoski, M., Kaasalainen, M., Ďurech, J., et al. 2015, A&A, 581, L3 [NASA ADS] [CrossRef] [EDP Sciences] [Google Scholar]
Their respective corotation critical arguments write as follows: ΨCER = 43λ − 42λG − ϖG and ΨCIR = 2 [43λ − 42λG − ΩG], where λ (λG) is the particle’s (Galatea’s) longitude, and ϖG and ΩG are the longitudes of the periapsis and the node of Galatea’s orbit, respectively.
All Tables
Parameters used to explore the validity of the 42:43 CER and CIR models: Neptune’s physical properties from Jacobson (2009) and the orbital inclination and eccentricity of Galatea derived by Showalter et al. (2019).
All Figures
|
Fig. 1 Observing conditions (airmass, seeing, and coherence time) at Paranal during the observation run (between 03:09:30.9281 and 07:58:36.2025 UT on August 23, 2016). The large fluctuations in coherence time, τ0, of atmospheric turbulence show that some images cannot be used, because of small τ0 values that are associated with fast atmospheric turbulence (the shaded light red horizontal band for which τ0 < 3.5 ms). The green shaded area represents the time window from which the final images used in our analysis were extracted (see text for explanation). These images correspond to the lowest airmass observing window. |
| In the text | |
|
Fig. 2 Left: single 64-second exposure of Neptune in the BB-Ks band (2.182 μm), 2016-08-23T05:12:52.2635 UT August 23, 2016, revealing the satellites Proteus (P), Galatea (G), and Larissa (L). The frame is 5.39 × 5.92 arcsec2 wide. The point source is due to a bad pixel cluster that is difficult to properly interpolate. Right: image of Neptune’s system obtained by co-adding 68 individual frames of the August 23, 2016, data (72 min and 32 s of total exposure time, between 04:24:50.5202 and 06:43:23.0627 UT). The frame is 6.99 × 6.99 arcsec2 wide. We can see Proteus (P) and Larissa (L) along their respective orbits during this time interval. We can also see the trail of Galatea (G) and the arcs, which evolve along the much fainter Adams ring. The bright arc on the left is due to thermal electronic noise. |
| In the text | |
|
Fig. 3 (a) 68 projected and co-added images of Neptune’s equatorial plane, revealing material along the arcs Fraternité and Égalité, as well as the satellites Proteus (P) and Galatea (G). The frame is 7.1 × 10.7 arcsec2 wide. (b) Equivalent width of the arcs (Fraternité and Égalité) vs. longitude extracted from Fig. 3b, at an angular resolution of 2°. The X-axis origin is the longitude LFr of the centre of the Fraternité arc measured from the J2000.0 ascending node, where LFr = 217.43 deg, at the reference epoch (see Table 1). |
| In the text | |
|
Fig. 4 Graphical illustration of the arcs’ semi-major axis, as well as the radii and widths of the CIR and CER motion resonances 42:43 with Galatea. The orange line depicts the geometrical orbital radius of the arcs, with uncertainties (in black dotted lines) smaller than the thickness of the orange line. The CIR and CER locations and widths are represented in blue and purple, respectively. They represent the interval in the semi-major axis where particles would be trapped by these resonances. This figure clearly shows the mismatch between the 42:43 CIR and the CER with Galatea and the arc’s position. The associated differences in longitude (Δ L) in Table 2 support this conclusion. |
| In the text | |
Current usage metrics show cumulative count of Article Views (full-text article views including HTML views, PDF and ePub downloads, according to the available data) and Abstracts Views on Vision4Press platform.
Data correspond to usage on the plateform after 2015. The current usage metrics is available 48-96 hours after online publication and is updated daily on week days.
Initial download of the metrics may take a while.