Fig. 4
Download original image
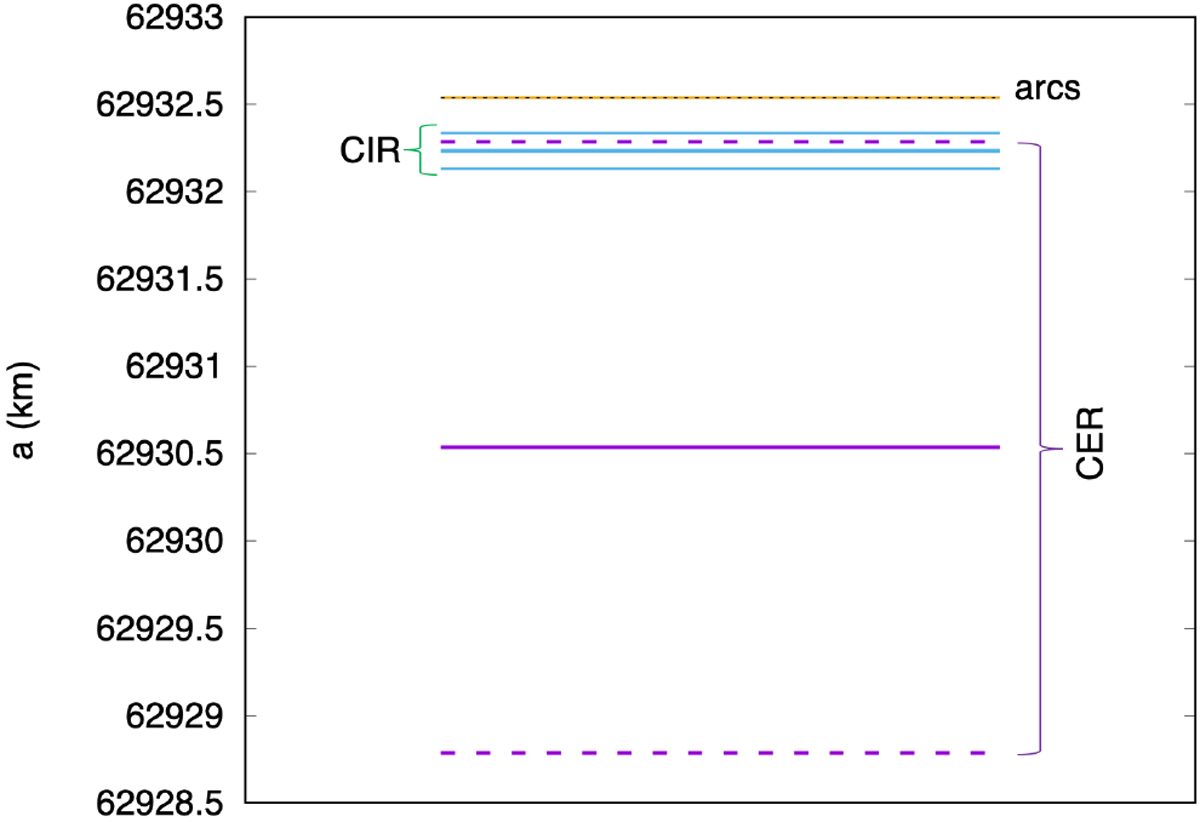
Graphical illustration of the arcs’ semi-major axis, as well as the radii and widths of the CIR and CER motion resonances 42:43 with Galatea. The orange line depicts the geometrical orbital radius of the arcs, with uncertainties (in black dotted lines) smaller than the thickness of the orange line. The CIR and CER locations and widths are represented in blue and purple, respectively. They represent the interval in the semi-major axis where particles would be trapped by these resonances. This figure clearly shows the mismatch between the 42:43 CIR and the CER with Galatea and the arc’s position. The associated differences in longitude (Δ L) in Table 2 support this conclusion.
Current usage metrics show cumulative count of Article Views (full-text article views including HTML views, PDF and ePub downloads, according to the available data) and Abstracts Views on Vision4Press platform.
Data correspond to usage on the plateform after 2015. The current usage metrics is available 48-96 hours after online publication and is updated daily on week days.
Initial download of the metrics may take a while.