Fig. A.1.
Download original image
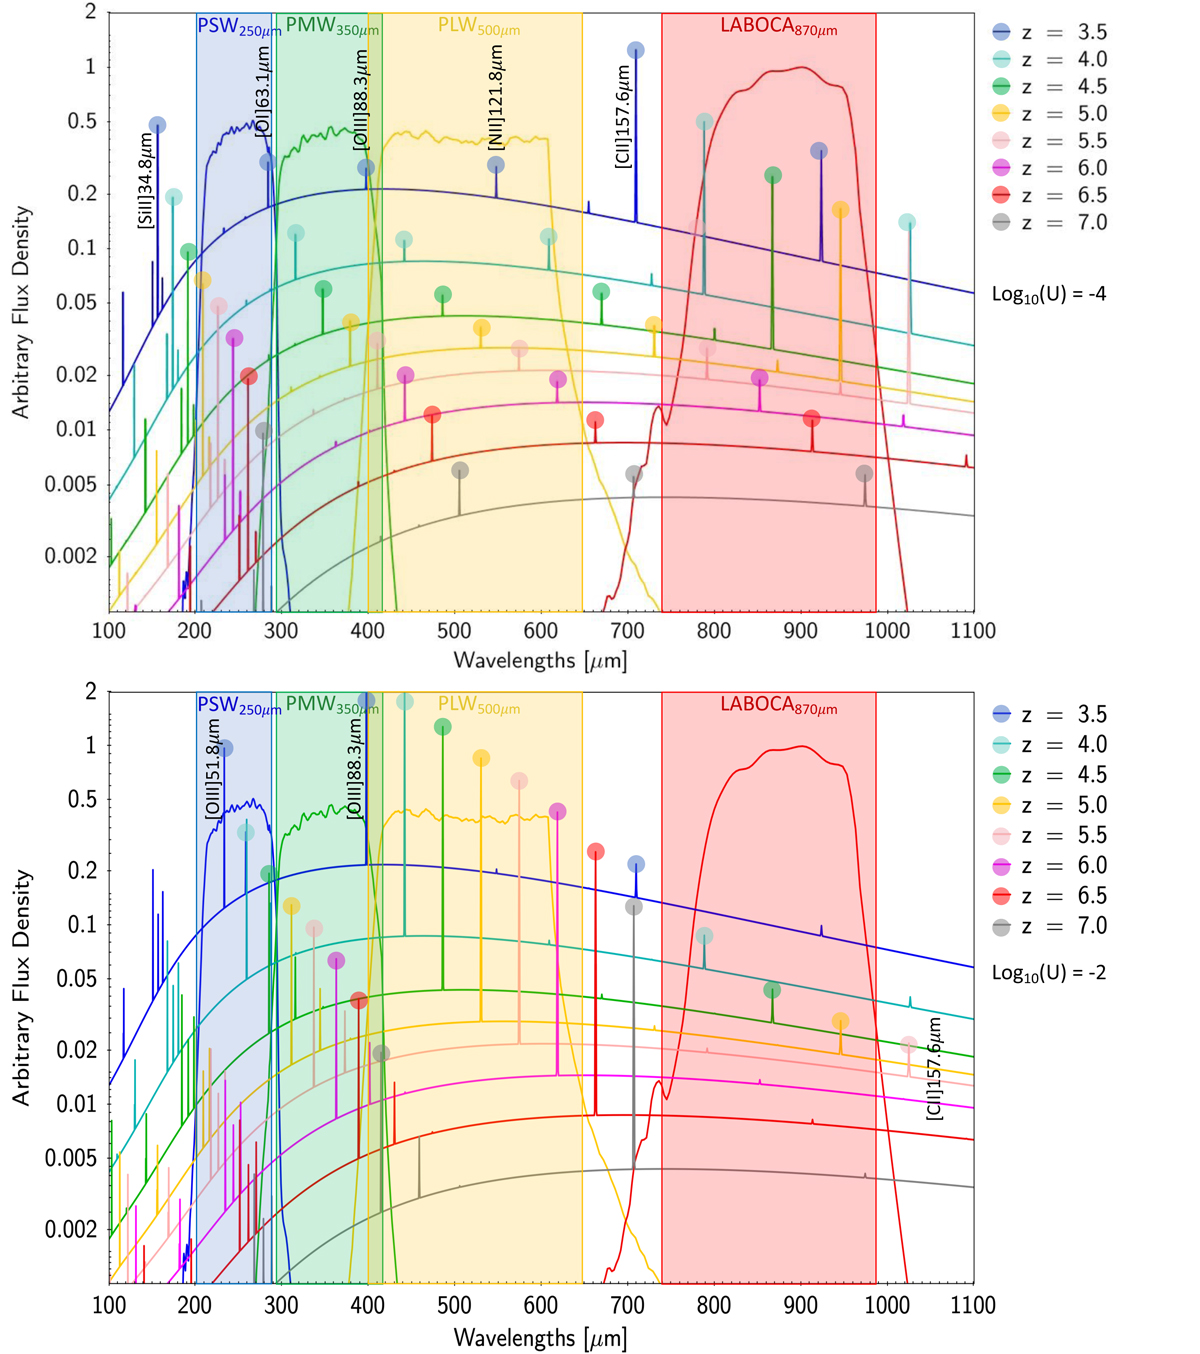
This figure identifies the emission lines that produce excesses in the broad-bands when the redshift increases. Top: At log10 U = -4.0, the strong [CII]157.6 μm lines enter the LABOCA870μm filters at z ∼ 4 and exit at z ∼ 5.2. The line induces an upward move of the corresponding ![]() colour. [SIII]34.8 μm enters the PSW250μm at z ∼ = 5.5, which boosts the
colour. [SIII]34.8 μm enters the PSW250μm at z ∼ = 5.5, which boosts the ![]() colour. We find a total move of the galaxies by about Δtotal ∼ 0.10 in the colour-colour diagram. These two combined effects explain that PDR-dominated galaxies at 4 ≲ z ≲ 6 are offset from the other galaxies. Bottom: Movement of the [OIII]51.8 μm and [OIII]88.3 μm lines of galaxies with a strong emission from HII regions at log10 U = -2.0 could induce specific colours that could help identify such galaxies from this colour-colour diagram. However, the effect is less clear as models with no lines can also lie here (Fig. 3).
colour. We find a total move of the galaxies by about Δtotal ∼ 0.10 in the colour-colour diagram. These two combined effects explain that PDR-dominated galaxies at 4 ≲ z ≲ 6 are offset from the other galaxies. Bottom: Movement of the [OIII]51.8 μm and [OIII]88.3 μm lines of galaxies with a strong emission from HII regions at log10 U = -2.0 could induce specific colours that could help identify such galaxies from this colour-colour diagram. However, the effect is less clear as models with no lines can also lie here (Fig. 3).
Current usage metrics show cumulative count of Article Views (full-text article views including HTML views, PDF and ePub downloads, according to the available data) and Abstracts Views on Vision4Press platform.
Data correspond to usage on the plateform after 2015. The current usage metrics is available 48-96 hours after online publication and is updated daily on week days.
Initial download of the metrics may take a while.