Fig. 7.
Download original image
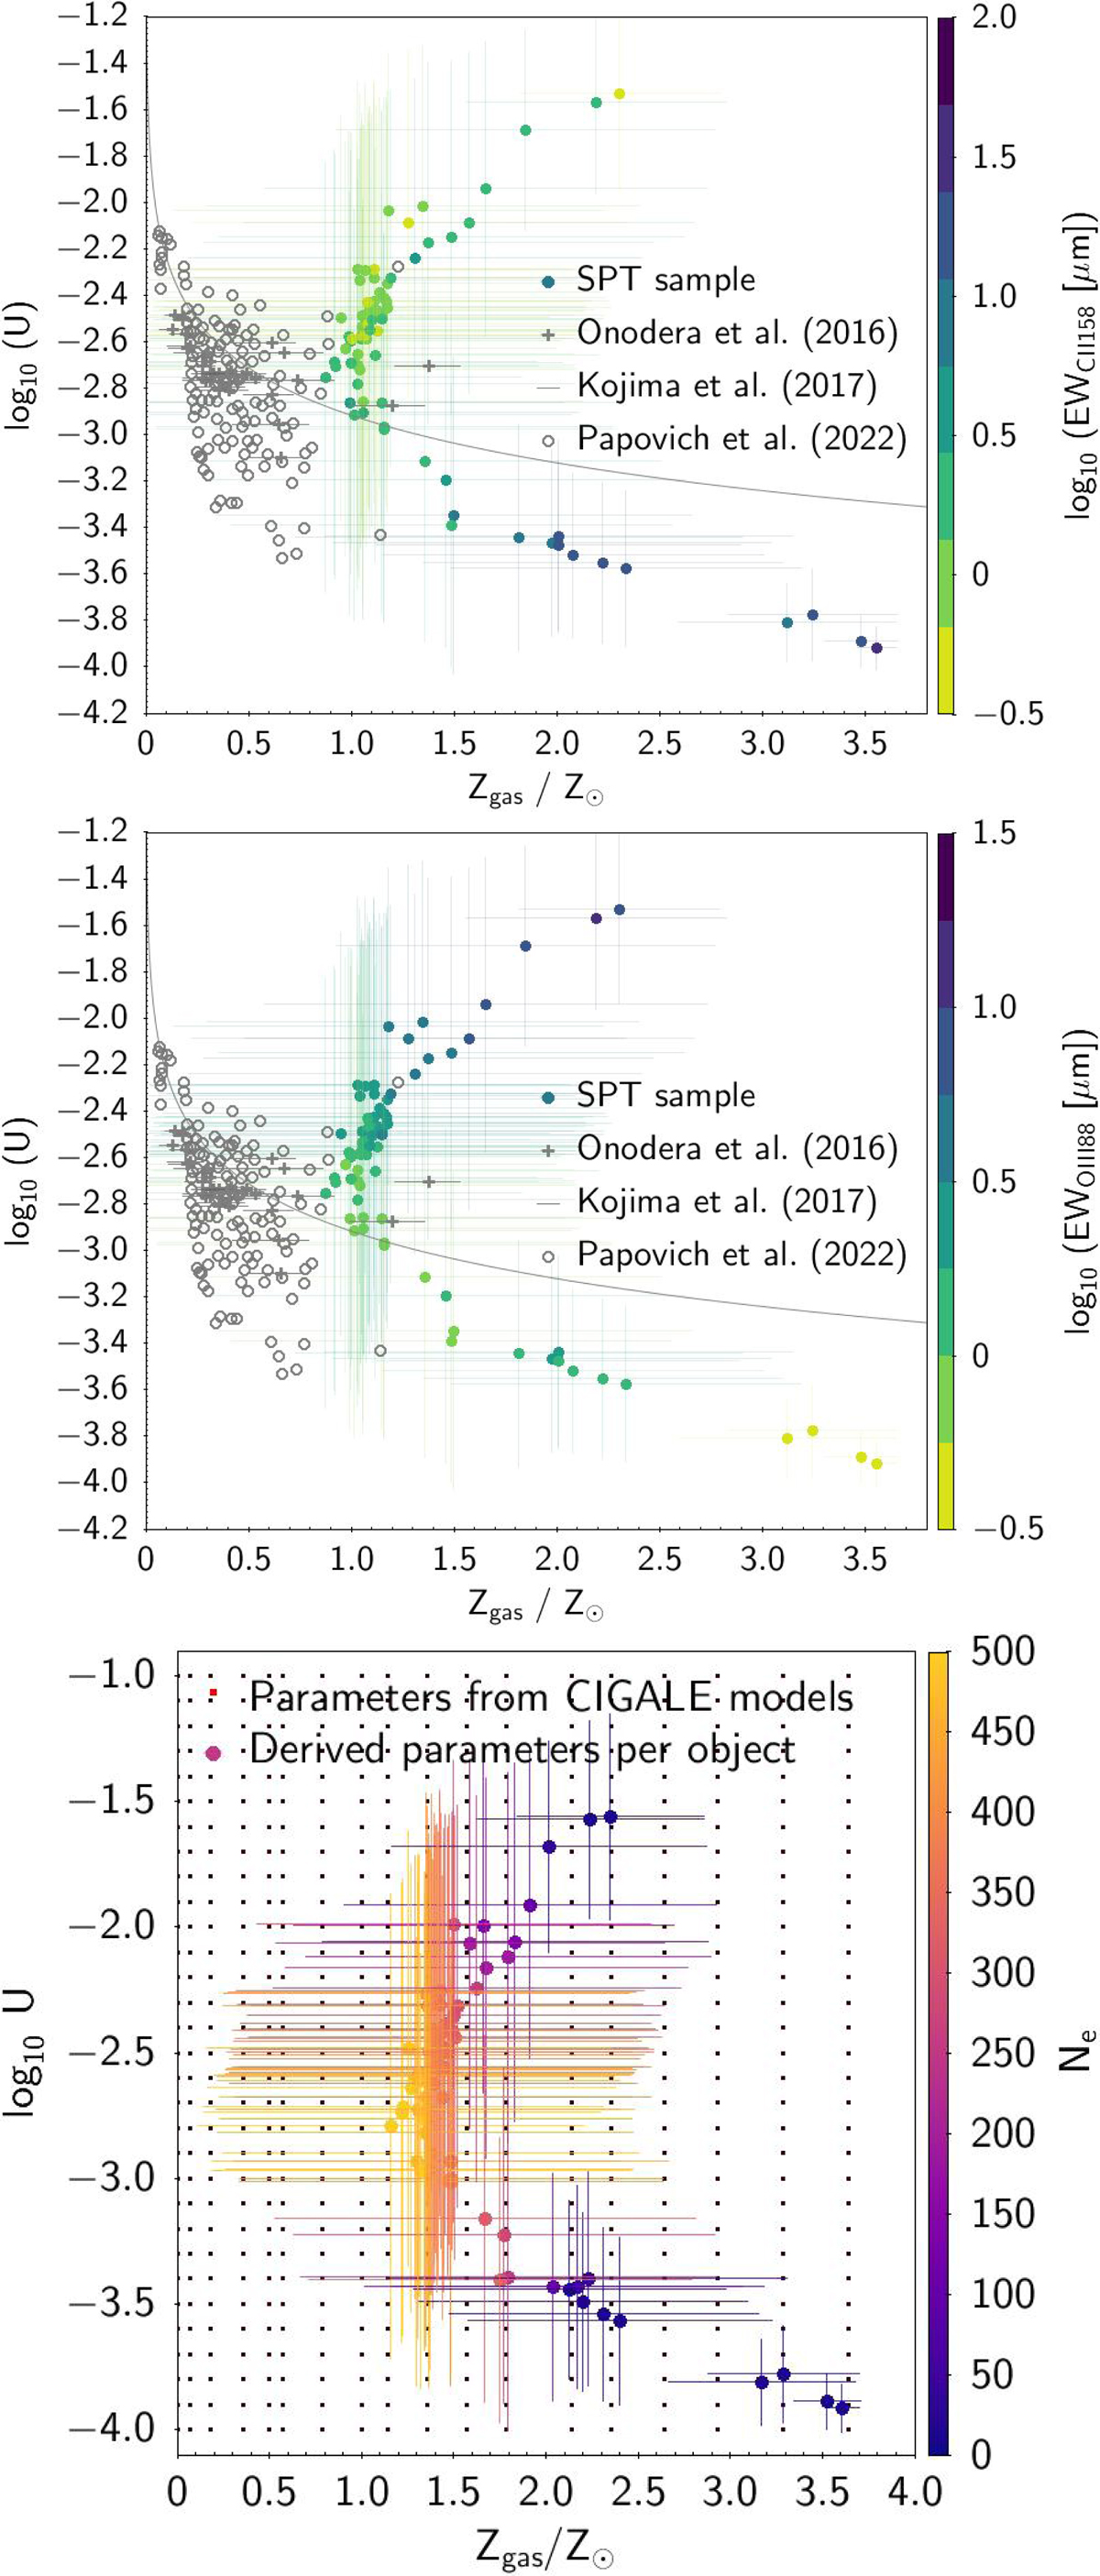
Sequence where we find LBGs at z ∼ 3.3 sample (Onodera et al. 2016) and fit (dashed line) to the sequence from Kojima et al. (2017) are shown in grey. Two different branches are identified for which the [CII]157.6 μm (centre) and [OIII]88.3 μm (top) lines are strong. The top branch contains galaxies that present a [CII] deficit and have a stronger ionisation parameter, log10U ≲ −2.5 while the bottom branch corresponds to galaxies with a normal-to-extreme PDR emission. The bottom panel shows the same information colour-coded with the electronic density, with the grid of models superimposed showing that we should be able to derive metallicities and ionisation parameters in between the two branches.
Current usage metrics show cumulative count of Article Views (full-text article views including HTML views, PDF and ePub downloads, according to the available data) and Abstracts Views on Vision4Press platform.
Data correspond to usage on the plateform after 2015. The current usage metrics is available 48-96 hours after online publication and is updated daily on week days.
Initial download of the metrics may take a while.