Fig. 6.
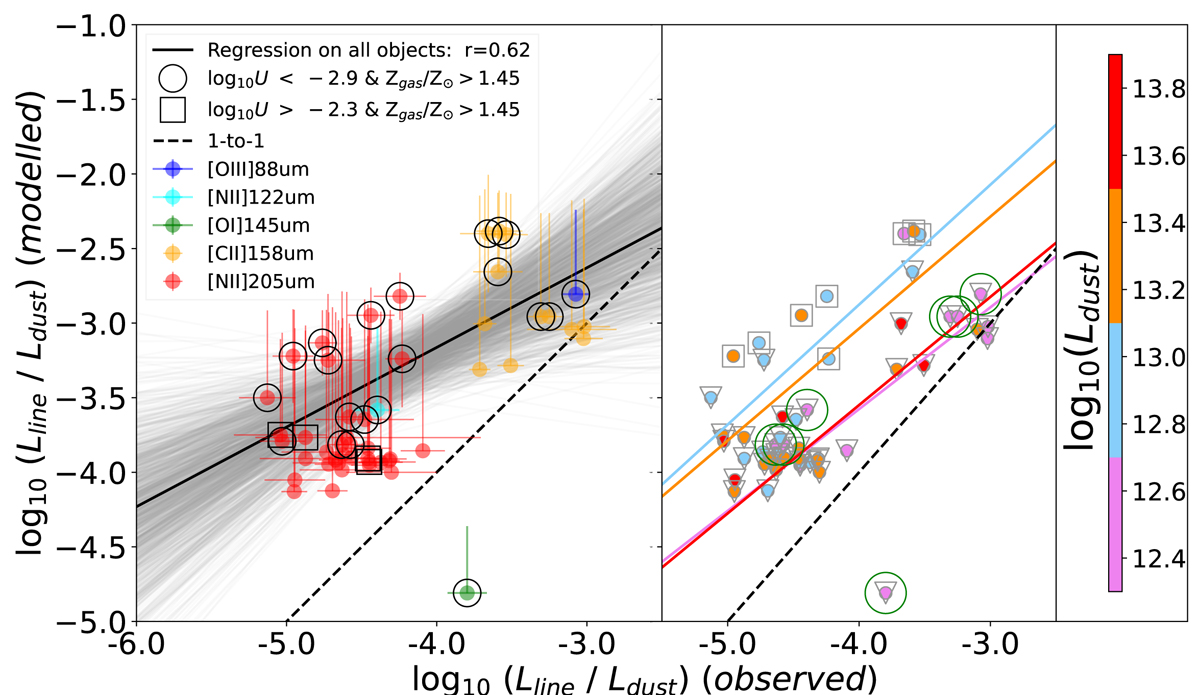
Download original image
Comparison of the CIGALE-derived line-to-dust luminosities to the observed ones. Left: comparison of observations and models for the spectroscopic sample of SPT galaxies. Most data are from [CII]157.6 μm (Lagache et al. 2018) and [NII]205.2 μm (Cunningham et al. 2020), except for SPT 0418-47 (De Breuck et al. 2019), for which we have several lines. Generally speaking, the brightest [CII]157.6 μm and [OIII]88.3 μm lines are better modelled than the [NII]122. μm and [NII]205.2 μm. The [OI]145. μm is an outlier in this frame. It could be because the former lines are stronger than the latter, or because of physical differences between them. Right: Symbols are colour-coded by intrinsic dust luminosity. The fits suggest that the objects with log10 Ldust < 12.7 and log10 Ldust > 13.5 are found closer to the one-to-one line, or vice versa, meaning that the line predictions for those with 12.7 < log10 Ldust < 13.5 are worse. The objects with a large green circle correspond to the sole object with different lines: SPT0418-47 from De Breuck et al. (2019) (see left panel to identify the lines).
Current usage metrics show cumulative count of Article Views (full-text article views including HTML views, PDF and ePub downloads, according to the available data) and Abstracts Views on Vision4Press platform.
Data correspond to usage on the plateform after 2015. The current usage metrics is available 48-96 hours after online publication and is updated daily on week days.
Initial download of the metrics may take a while.