Fig. 5.
Download original image
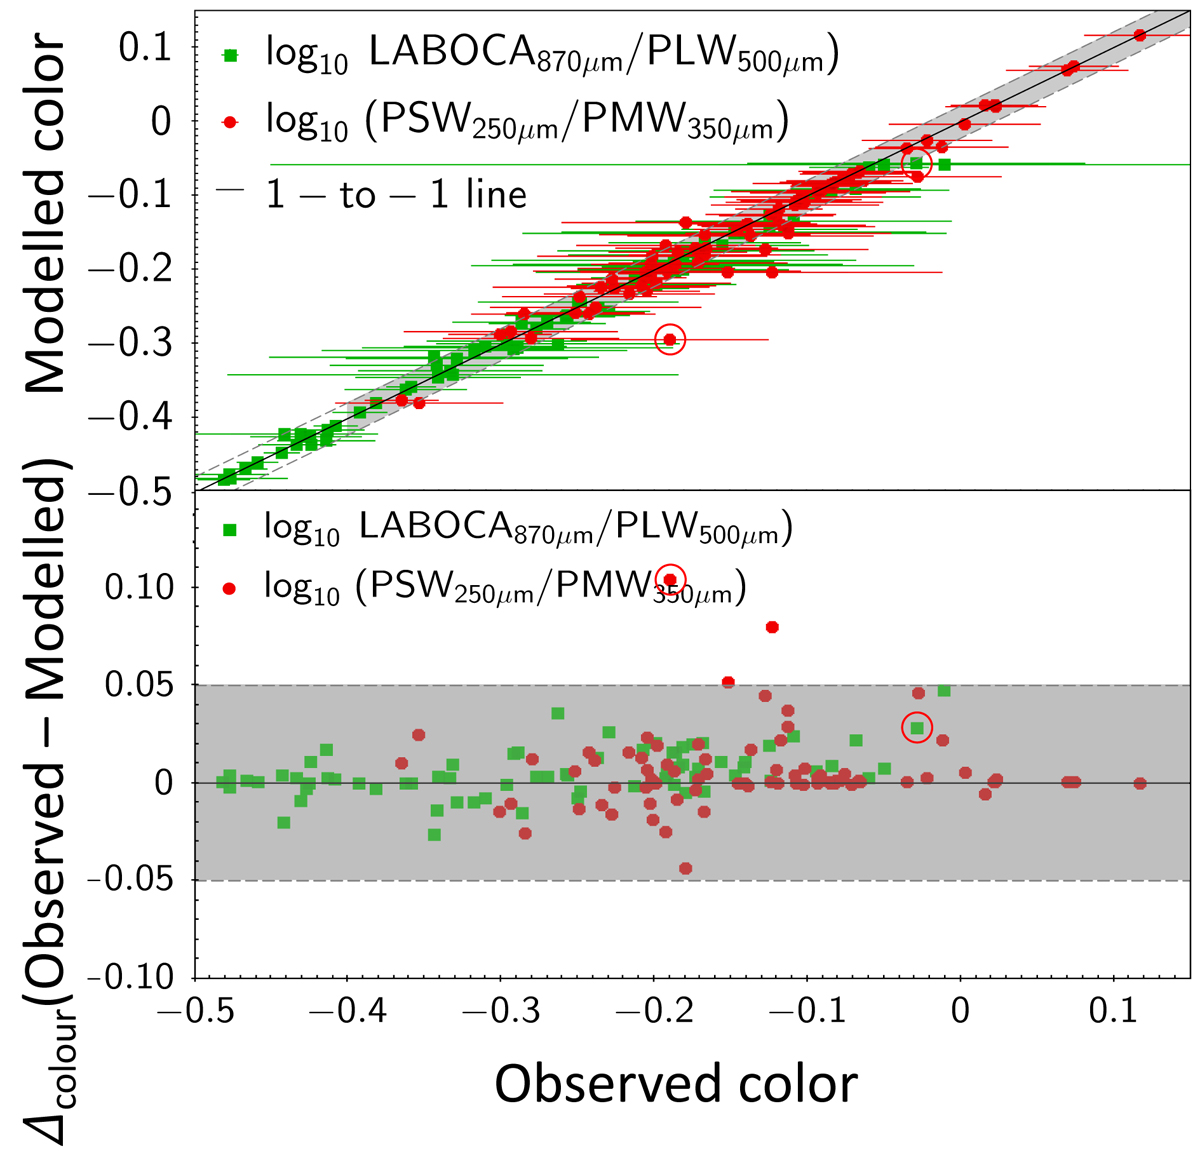
Comparison of compared and observed colours. This figure shows that we can reproduce the observed colours with the CIGALE models. Top: modelled colours (green boxes for ![]() and red dots for
and red dots for ![]() ) are in excellent agreement with the observed ones within the observed uncertainties. The black line shows the one-to-one line, and the grey shaded area presents the boundaries at ±5% (y = 0.95 x and y = 1.05 x). Bottom: This conclusion is confirmed in this panel, where we present the absolute differences in the logarithm of the two colours used in Fig. 3. In both panels, the red circled point corresponds to SPT0348-62, which is already identified in Fig. 3 as one of the objects only partially covered by the models.
) are in excellent agreement with the observed ones within the observed uncertainties. The black line shows the one-to-one line, and the grey shaded area presents the boundaries at ±5% (y = 0.95 x and y = 1.05 x). Bottom: This conclusion is confirmed in this panel, where we present the absolute differences in the logarithm of the two colours used in Fig. 3. In both panels, the red circled point corresponds to SPT0348-62, which is already identified in Fig. 3 as one of the objects only partially covered by the models.
Current usage metrics show cumulative count of Article Views (full-text article views including HTML views, PDF and ePub downloads, according to the available data) and Abstracts Views on Vision4Press platform.
Data correspond to usage on the plateform after 2015. The current usage metrics is available 48-96 hours after online publication and is updated daily on week days.
Initial download of the metrics may take a while.