Fig. 4.
Download original image
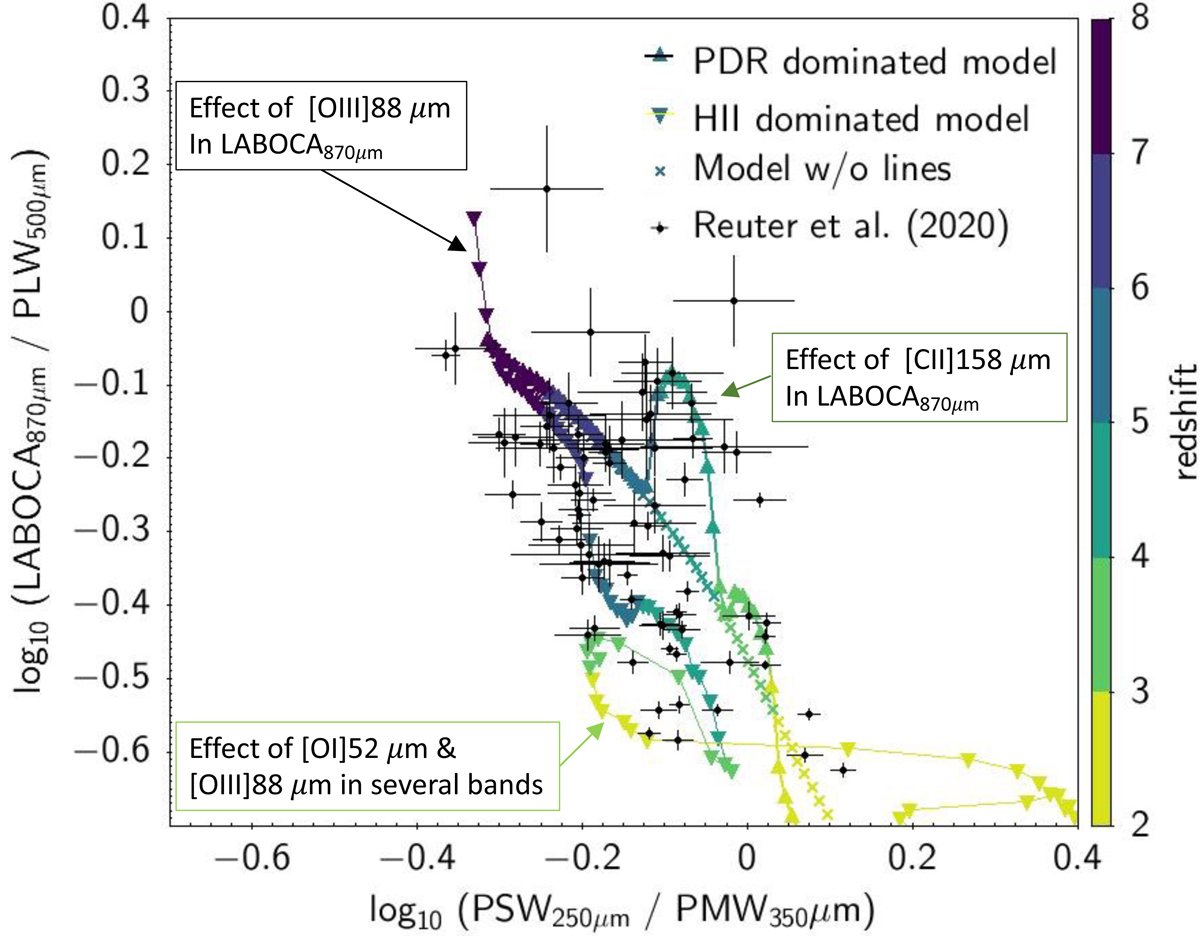
Evolution of the predicted colours with redshift. When compared to models without lines (crosses), at log10U = −4.0 (upward triangles), the strong [CII]157.6 μm line induces an upward move of log10
![]() that corresponds to the clump of galaxies at z ∼ 4–6. However, even though the move of the [OIII]51.8 μm and [OIII]88.3 μm lines of galaxies with a strong emission from HII regions at log10U = −2.0 (downward triangles) could induce specific colours, the effect is less clear as models with no lines can also lie in this same region of the plot (Fig. 3). All the symbols are colour-coded by redshift.
that corresponds to the clump of galaxies at z ∼ 4–6. However, even though the move of the [OIII]51.8 μm and [OIII]88.3 μm lines of galaxies with a strong emission from HII regions at log10U = −2.0 (downward triangles) could induce specific colours, the effect is less clear as models with no lines can also lie in this same region of the plot (Fig. 3). All the symbols are colour-coded by redshift.
Current usage metrics show cumulative count of Article Views (full-text article views including HTML views, PDF and ePub downloads, according to the available data) and Abstracts Views on Vision4Press platform.
Data correspond to usage on the plateform after 2015. The current usage metrics is available 48-96 hours after online publication and is updated daily on week days.
Initial download of the metrics may take a while.