Fig. 3.
Download original image
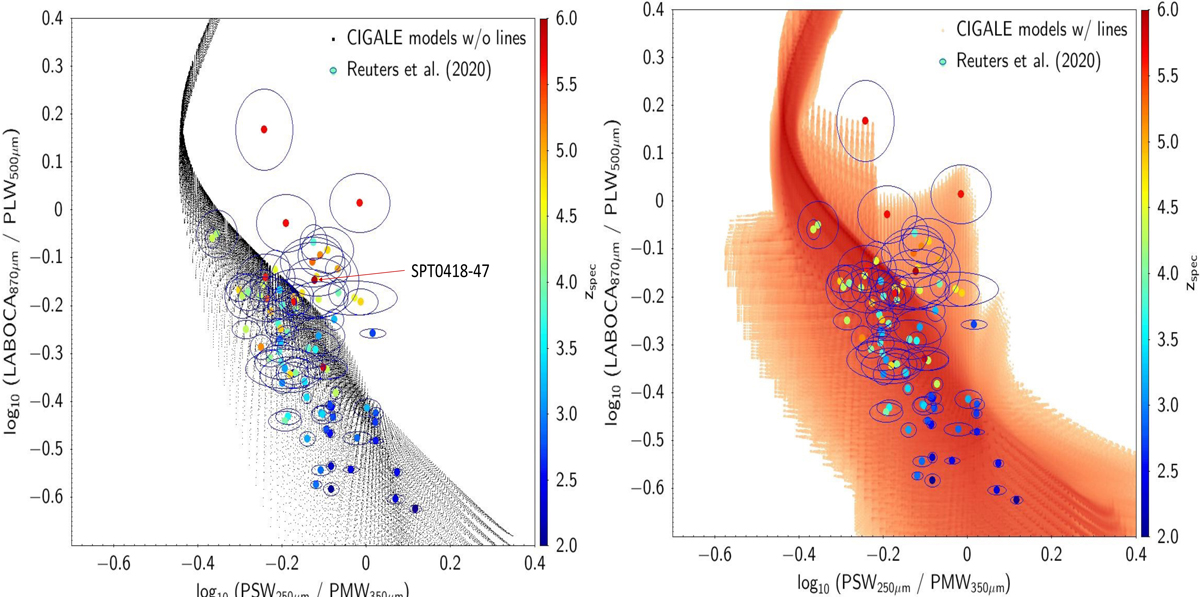
Models computed by CIGALE for the [![]() versus
versus ![]() ] colours. Left: when no fine structure emission lines are added to the modelled spectra, the modelled galaxies are mainly located on a prime sequence extending from the bottom right to the top left. However, a clump of high-redshift observed galaxies, with colours [
] colours. Left: when no fine structure emission lines are added to the modelled spectra, the modelled galaxies are mainly located on a prime sequence extending from the bottom right to the top left. However, a clump of high-redshift observed galaxies, with colours [![]() versus
versus ![]() ] ≈ [−0.1, −0.1], and with a total offset from the main sequence of the order of Δcolour ∼ 0.1 − 0.2 cannot be reached by these models without emission lines. Right: emission lines are added to the continuum. When large equivalent width fine structure lines (and more specifically, EW([CII]157.6 μm) ∼ 10–20 μm) are added (Appendix A), the CIGALE models cover this clump of high-redshift galaxies. The three highest points are only partially covered by the models. Even though the two top ones (namely SPT0243-49 and SPT0245-63) are clearly high-redshift objects, respectively at z = 5.702 and z = 5.626, we assumed that the partial coverage is not sufficient and do not use these two objects in the rest of the paper. For the third one (SPT0348-62 at z = 5.654), the coverage by the models allows us to keep it in the analysis. We also identify SPT0418-47, for which we have five emission lines in the considered wavelength range, and an amplification factor of μ = 32.70 (Reuter et al. 2020).
] ≈ [−0.1, −0.1], and with a total offset from the main sequence of the order of Δcolour ∼ 0.1 − 0.2 cannot be reached by these models without emission lines. Right: emission lines are added to the continuum. When large equivalent width fine structure lines (and more specifically, EW([CII]157.6 μm) ∼ 10–20 μm) are added (Appendix A), the CIGALE models cover this clump of high-redshift galaxies. The three highest points are only partially covered by the models. Even though the two top ones (namely SPT0243-49 and SPT0245-63) are clearly high-redshift objects, respectively at z = 5.702 and z = 5.626, we assumed that the partial coverage is not sufficient and do not use these two objects in the rest of the paper. For the third one (SPT0348-62 at z = 5.654), the coverage by the models allows us to keep it in the analysis. We also identify SPT0418-47, for which we have five emission lines in the considered wavelength range, and an amplification factor of μ = 32.70 (Reuter et al. 2020).
Current usage metrics show cumulative count of Article Views (full-text article views including HTML views, PDF and ePub downloads, according to the available data) and Abstracts Views on Vision4Press platform.
Data correspond to usage on the plateform after 2015. The current usage metrics is available 48-96 hours after online publication and is updated daily on week days.
Initial download of the metrics may take a while.