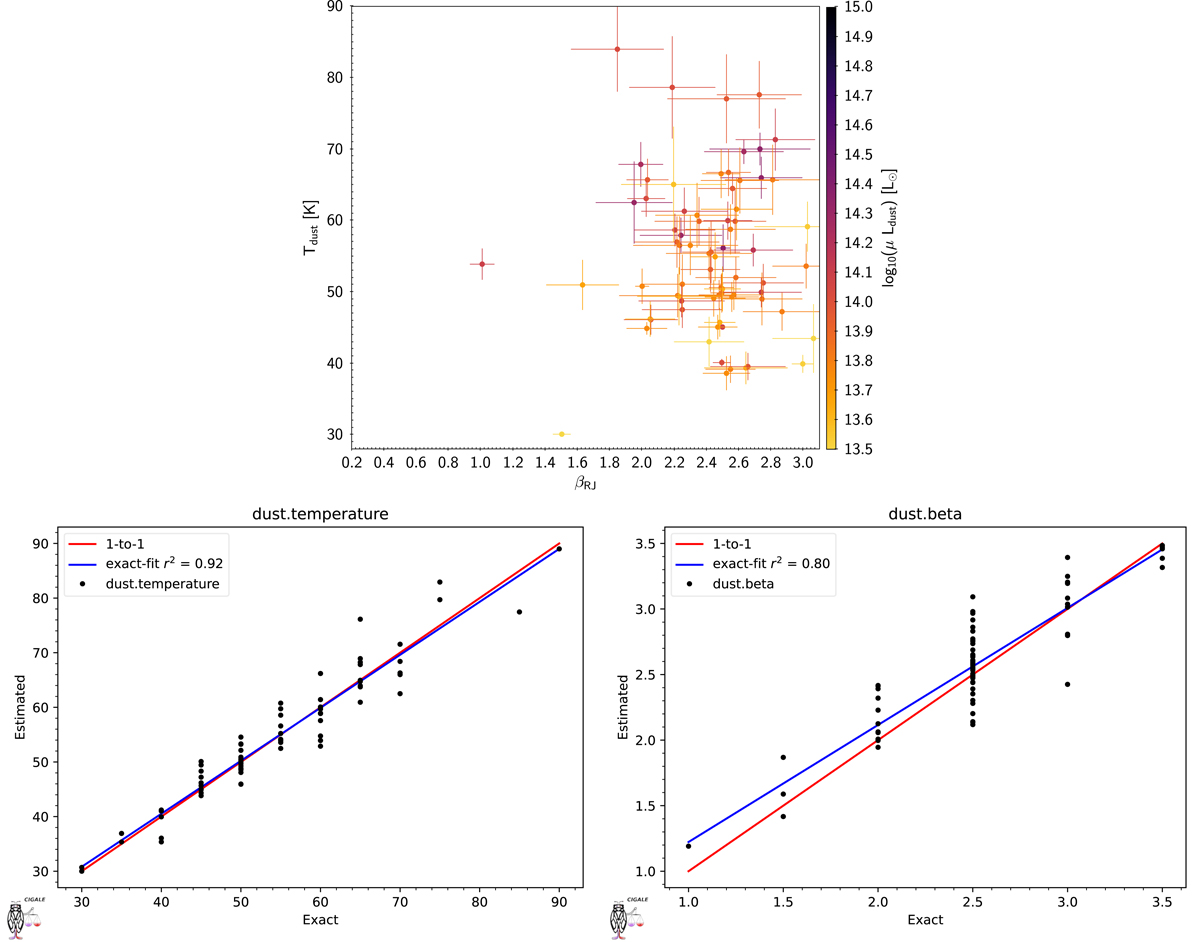
Fig. 2.
Download original image
How the dust continuum was taken into account in the analysis. Top panel shows the distribution of Tdust and βRL for the SPT sample. In the bottom panel, we used the CIGALE mock analysis to check whether Tdust and βRL can be correctly estimated using the available set of data for this SPT sample. In this mock analysis, we use the best models and each of the exact parameters used to build the models for each of the objects. We add the observed noise to the models, and refit the simulated data to re-estimate the same dust and βRL parameters. A good correlation between the ‘estimated’ and the ‘exact’ Tdust and βRL suggests that we are able to derive them correctly.
Current usage metrics show cumulative count of Article Views (full-text article views including HTML views, PDF and ePub downloads, according to the available data) and Abstracts Views on Vision4Press platform.
Data correspond to usage on the plateform after 2015. The current usage metrics is available 48-96 hours after online publication and is updated daily on week days.
Initial download of the metrics may take a while.