Fig. C.1
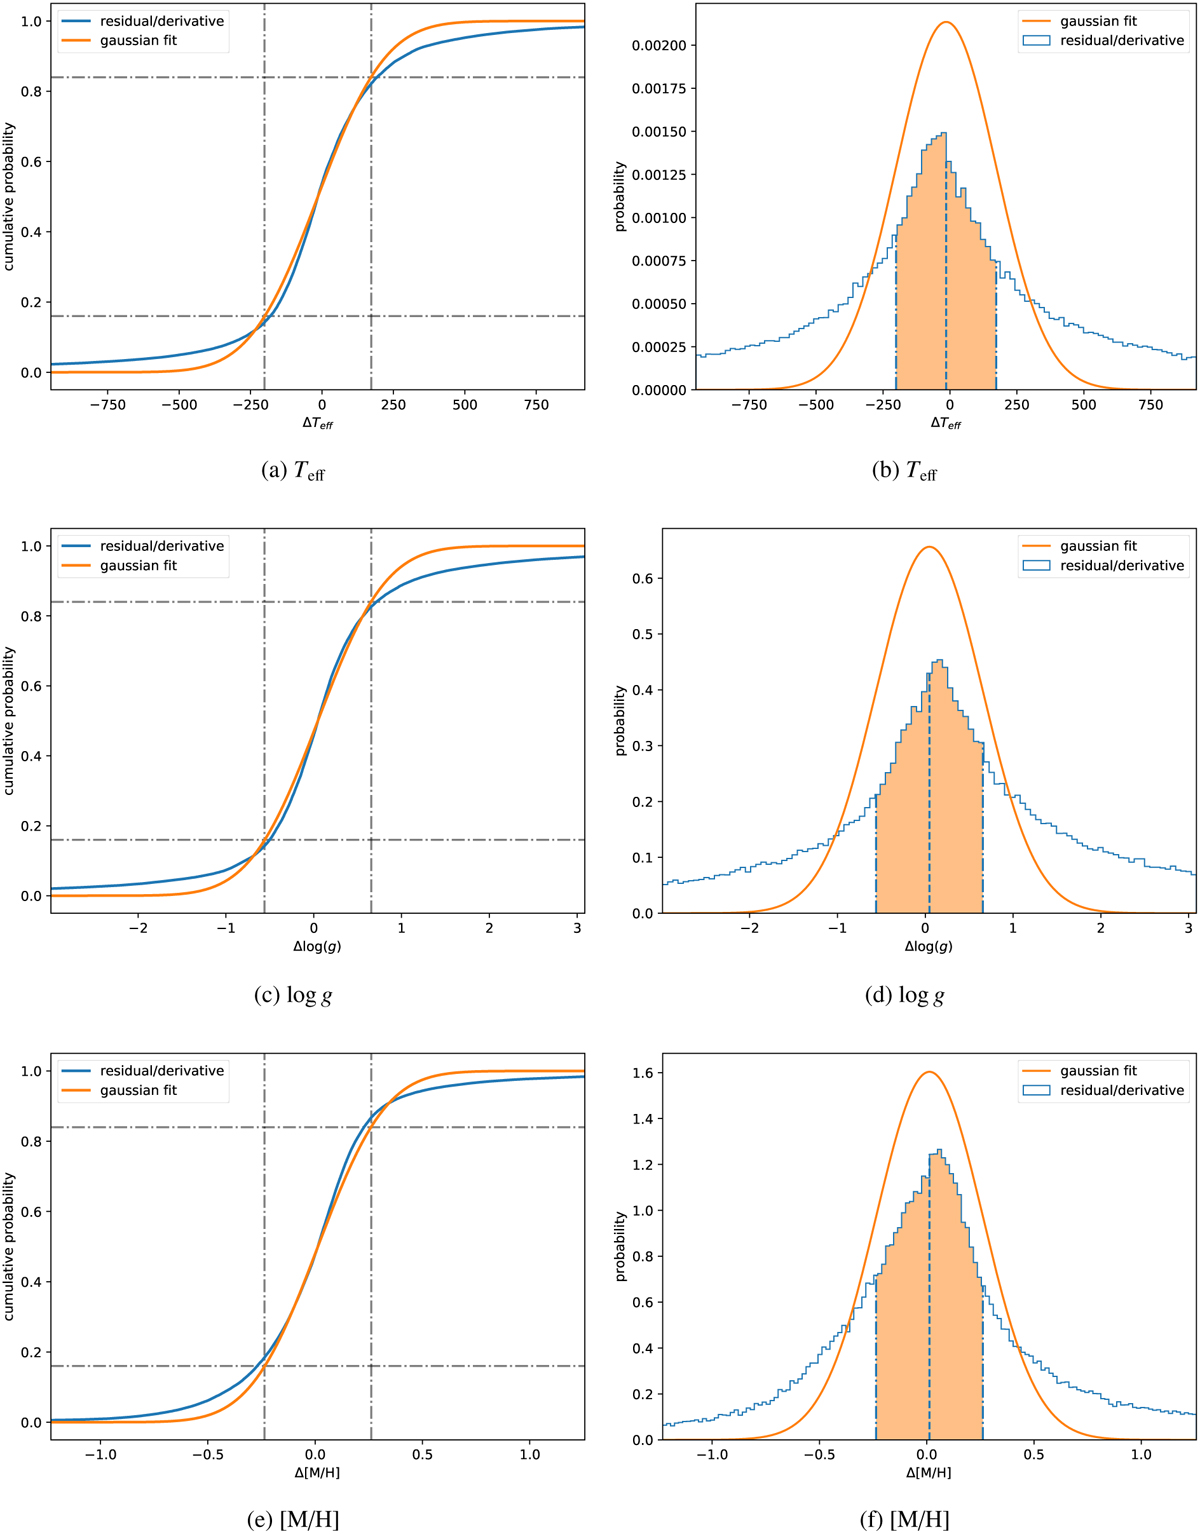
Download original image
Cumulative probability (left) and probability density (right) distribution of the fitting parameters for the ϵ Eri spectrum derived from the fit results (blue). For comparison, also shown is the distribution of a Gaussian with the same median and σ as derived from the cumulative probability. The median is indicated by a dashed line (in density plots only), and the 1σ range is shown as a shaded region and dash dotted lines.
Current usage metrics show cumulative count of Article Views (full-text article views including HTML views, PDF and ePub downloads, according to the available data) and Abstracts Views on Vision4Press platform.
Data correspond to usage on the plateform after 2015. The current usage metrics is available 48-96 hours after online publication and is updated daily on week days.
Initial download of the metrics may take a while.