Fig. 8.
Download original image
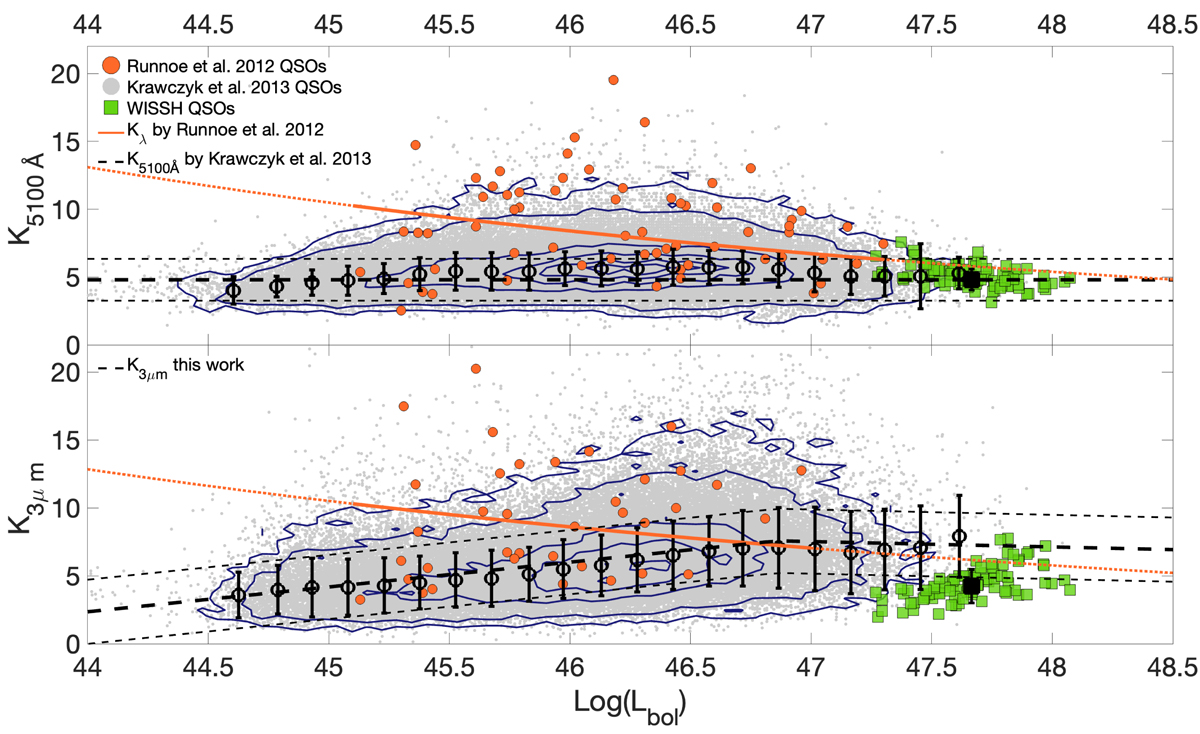
Bolometric corrections at λ = 5100 Å and 3 μm vs. Lbol. Top panel: K5100 Å vs. Log(Lbol), in units of [erg s−1]. QSOs from Runnoe et al. (2012a) are shown as orange filled circles. Gray circles depict QSOs from Krawczyk et al. (2013), while black circles provide their median values (with the associated spread) over bins of width 0.15 dex. WISSH QSOs are shown as green squares, and the black square indicates their mean. The solid orange line describe the nonlinear relationship by Runnoe et al. (2012a), the dotted line indicates that the relation is being extrapolated to lower or higher luminosities. The dashed black lines give the linear relationship by K13 and its associated uncertainty. Bottom panel: K3 μm vs. Log(Lbol), color-coded as above. Here the dashed black lines depict the best fit computed as explained in Sect. 5.4.1 and its uncertainty computed as the square root of the variance with respect to the best-fit prediction.
Current usage metrics show cumulative count of Article Views (full-text article views including HTML views, PDF and ePub downloads, according to the available data) and Abstracts Views on Vision4Press platform.
Data correspond to usage on the plateform after 2015. The current usage metrics is available 48-96 hours after online publication and is updated daily on week days.
Initial download of the metrics may take a while.