Fig. 15.
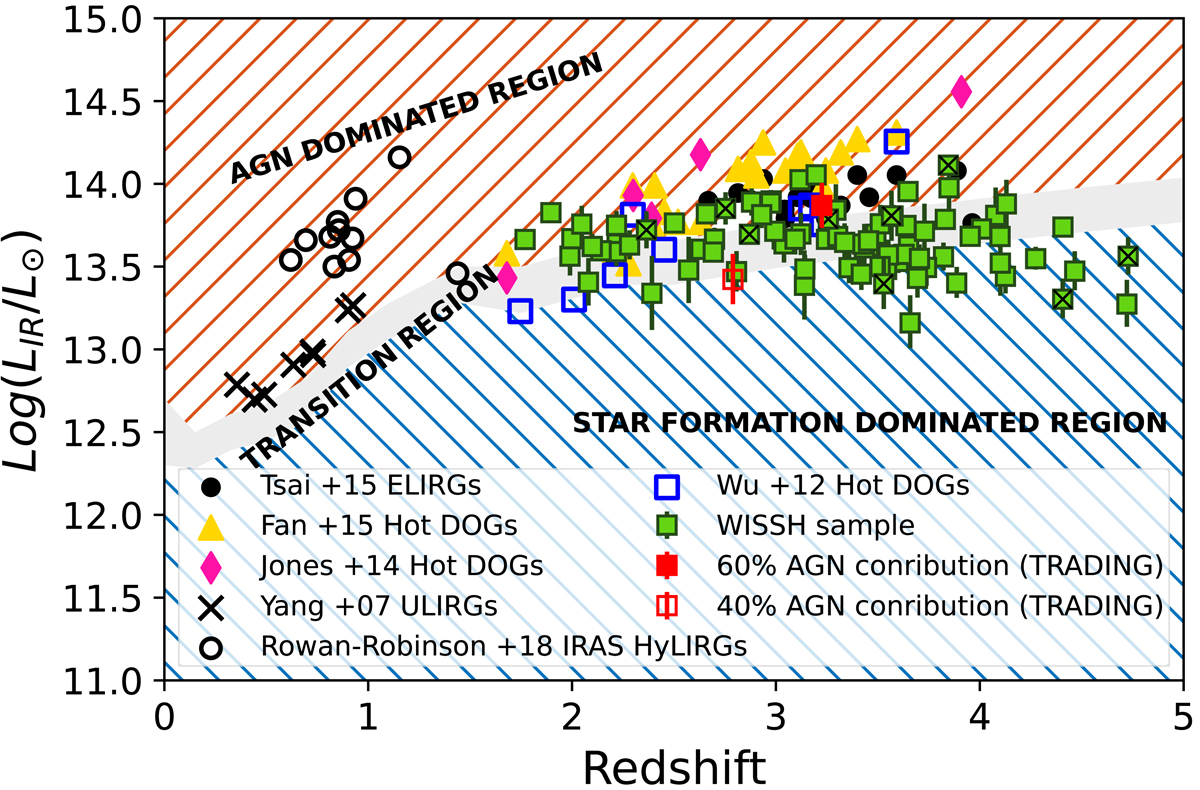
Download original image
[Adapted from Fig. 8 in Symeonidis & Page (2021)]. Redshift vs. L8 − 1000 μm diagram partitioned into an AGN dominated region, a transition region, and a star formation dominated region. Overplotted are various samples from the literature: the IRAS-selected HyLIRGs from Rowan-Robinson et al. (2018), the intermediate redshift ULIRGs from Yang et al. (2007), the optically unobscured QSOs from Tsai et al. (2015), and the hot dust obscured galaxies (hot DOGs) from Fan et al. (2016), Jones et al. (2014), and Wu et al. (2012). The WISSH quasars studied in this work are shown as green squares. Symbols with an “x” inside represent QSOs with FIR ALMA/NOEMA coverage. Plotted as red squares are WISSH08 and WISSH51, for which Duras et al. (2017) evaluated the AGN contribution to LIR.
Current usage metrics show cumulative count of Article Views (full-text article views including HTML views, PDF and ePub downloads, according to the available data) and Abstracts Views on Vision4Press platform.
Data correspond to usage on the plateform after 2015. The current usage metrics is available 48-96 hours after online publication and is updated daily on week days.
Initial download of the metrics may take a while.