Open Access
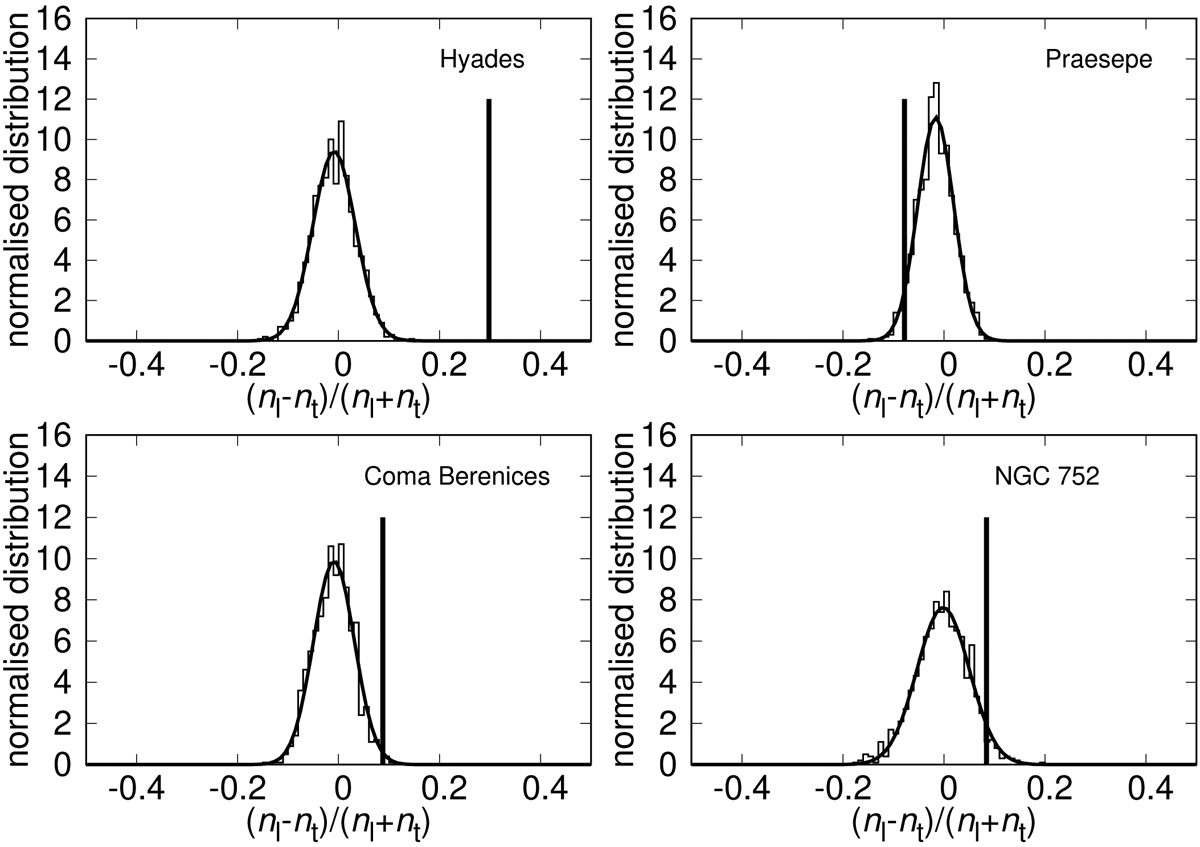
Fig. 9.
Download original image
Monte Carlo results for the minimum model. Normalised distribution of the asymmetry in the Monte Carlo simulations for each star cluster model. The solid curve is the best-fitting Gaussian distribution function. The vertical solid line marks the observed value (Table 1).
Current usage metrics show cumulative count of Article Views (full-text article views including HTML views, PDF and ePub downloads, according to the available data) and Abstracts Views on Vision4Press platform.
Data correspond to usage on the plateform after 2015. The current usage metrics is available 48-96 hours after online publication and is updated daily on week days.
Initial download of the metrics may take a while.