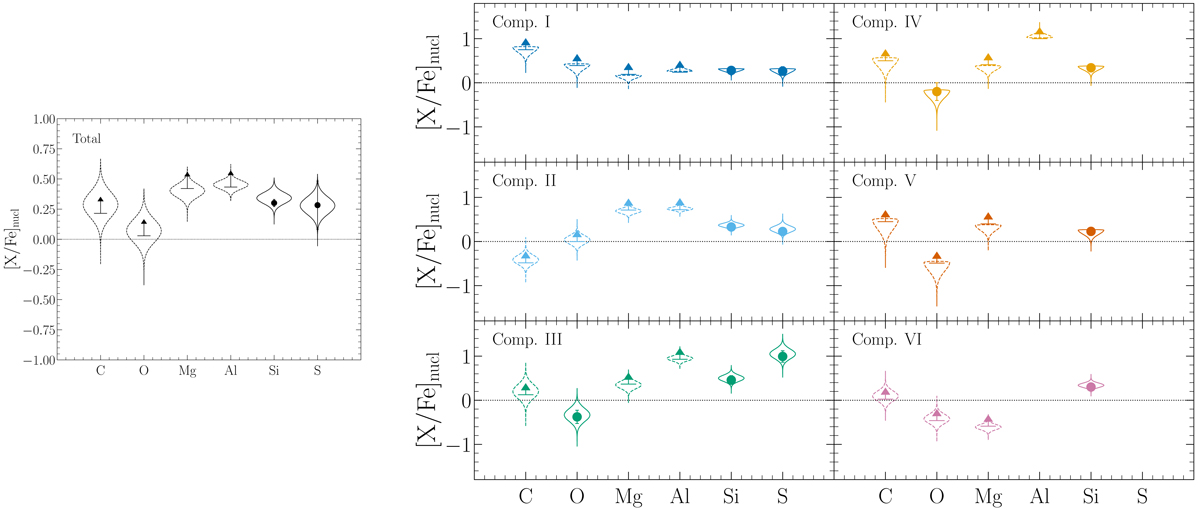
Fig. 9.
Download original image
Abundances of different elements with respect to iron after correcting for dust depletion, for the total (left panel) and component-by-component (right panel) analysis. Limits are indicated by arrows and the error bars represent the uncertainty propagated from column density measurements; the violin plots represents the uncertainty caused by dust depletion estimated using one million Monte Carlo realizations of the [Zn/Fe]fit. The impact of dust depletion on the nuclear abundances is correlated between elements; i.e., a higher dust depletion correction lowers all [X/Fe] values except for [Al/Fe] which it raises, and vice-versa.
Current usage metrics show cumulative count of Article Views (full-text article views including HTML views, PDF and ePub downloads, according to the available data) and Abstracts Views on Vision4Press platform.
Data correspond to usage on the plateform after 2015. The current usage metrics is available 48-96 hours after online publication and is updated daily on week days.
Initial download of the metrics may take a while.