Open Access
Fig. 8.
Download original image
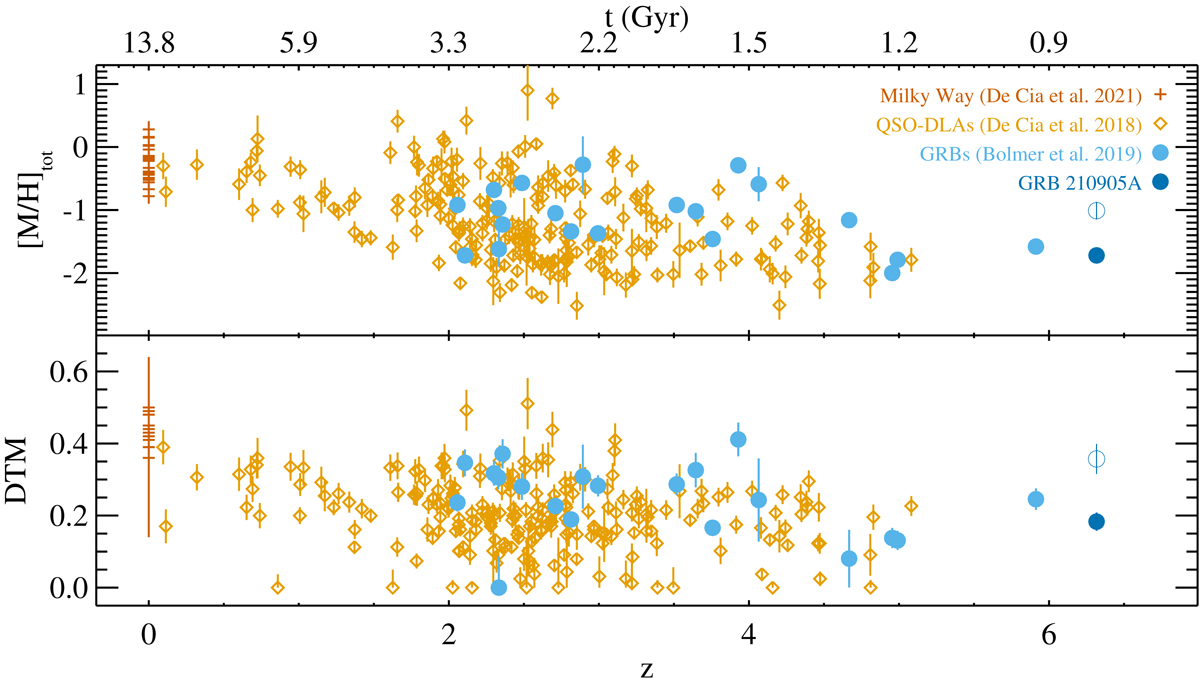
Evolution of [M/H]tot (top panel) and DTM (bottom panel) over cosmic time of the MW and of QSO- and GRB-DLAs. GRB 210905A values are shown in dark blue dots (the empty circles refer to the values determined not considering α-element enhancement).
Current usage metrics show cumulative count of Article Views (full-text article views including HTML views, PDF and ePub downloads, according to the available data) and Abstracts Views on Vision4Press platform.
Data correspond to usage on the plateform after 2015. The current usage metrics is available 48-96 hours after online publication and is updated daily on week days.
Initial download of the metrics may take a while.