Open Access
Fig. 4.
Download original image
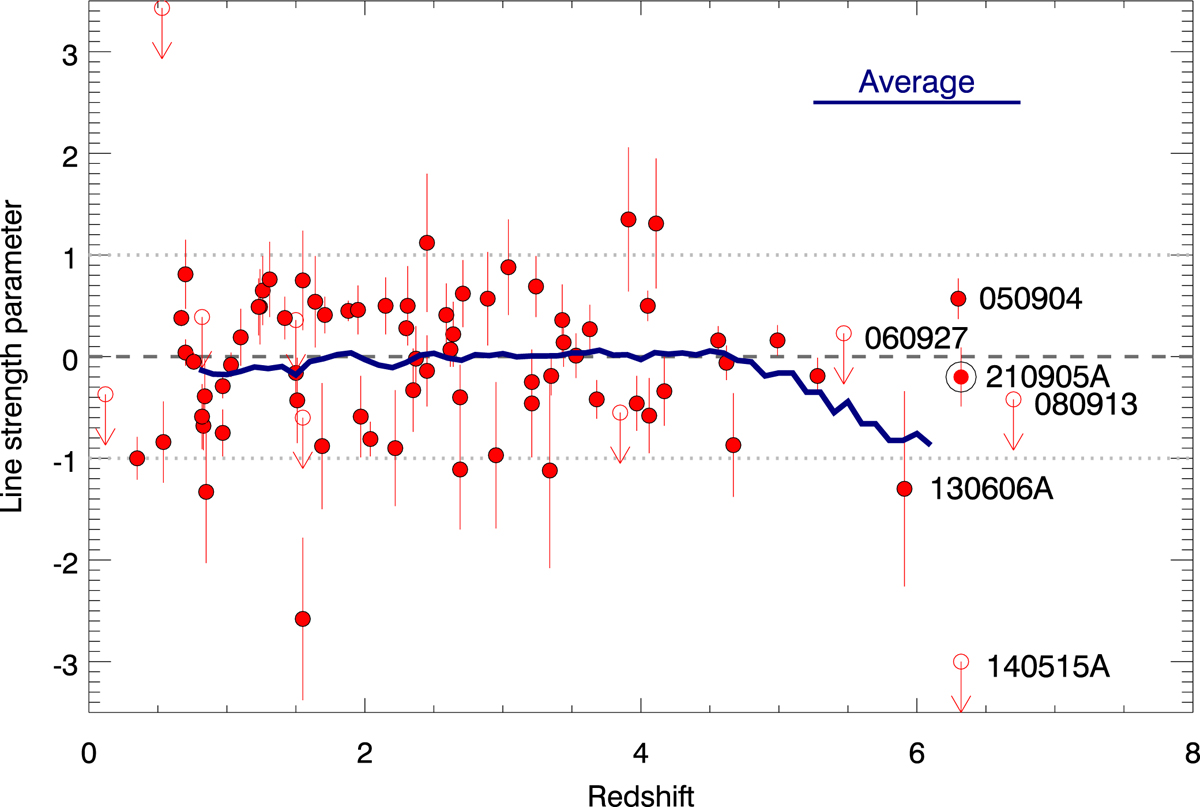
Evolution of the LSP with redshift. The blue line represents a rolling average of the LSP with a window of 1.5 in redshift, as indicated in the plot. The limits below zero have been considered as detections for the calculation of this average, which makes it, strictly speaking, an upper limit.
Current usage metrics show cumulative count of Article Views (full-text article views including HTML views, PDF and ePub downloads, according to the available data) and Abstracts Views on Vision4Press platform.
Data correspond to usage on the plateform after 2015. The current usage metrics is available 48-96 hours after online publication and is updated daily on week days.
Initial download of the metrics may take a while.