Fig. A.3.
Download original image
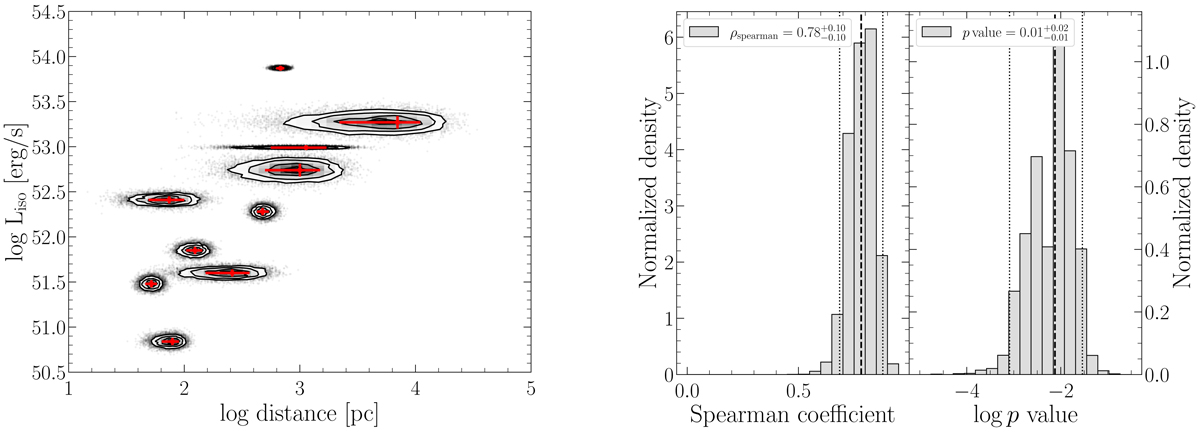
Correlation between the distance of the closest low-ionization gas clouds and the GRB luminosity. Left panel: Monte Carlo simulation of the Liso-distance relation. In red the Liso (erg s−1) and distance (parsecs) values with their error bars for the GRBs with available measurements, while the contours represent the result of the simulation of N = 10000 realizations. Right panel: Probability density function of the Spearman coefficient and the associated p-value for each realization. The black dashed line represents the median value while the dotted ones represent the 2 σ intervals.
Current usage metrics show cumulative count of Article Views (full-text article views including HTML views, PDF and ePub downloads, according to the available data) and Abstracts Views on Vision4Press platform.
Data correspond to usage on the plateform after 2015. The current usage metrics is available 48-96 hours after online publication and is updated daily on week days.
Initial download of the metrics may take a while.