Fig. A.2.
Download original image
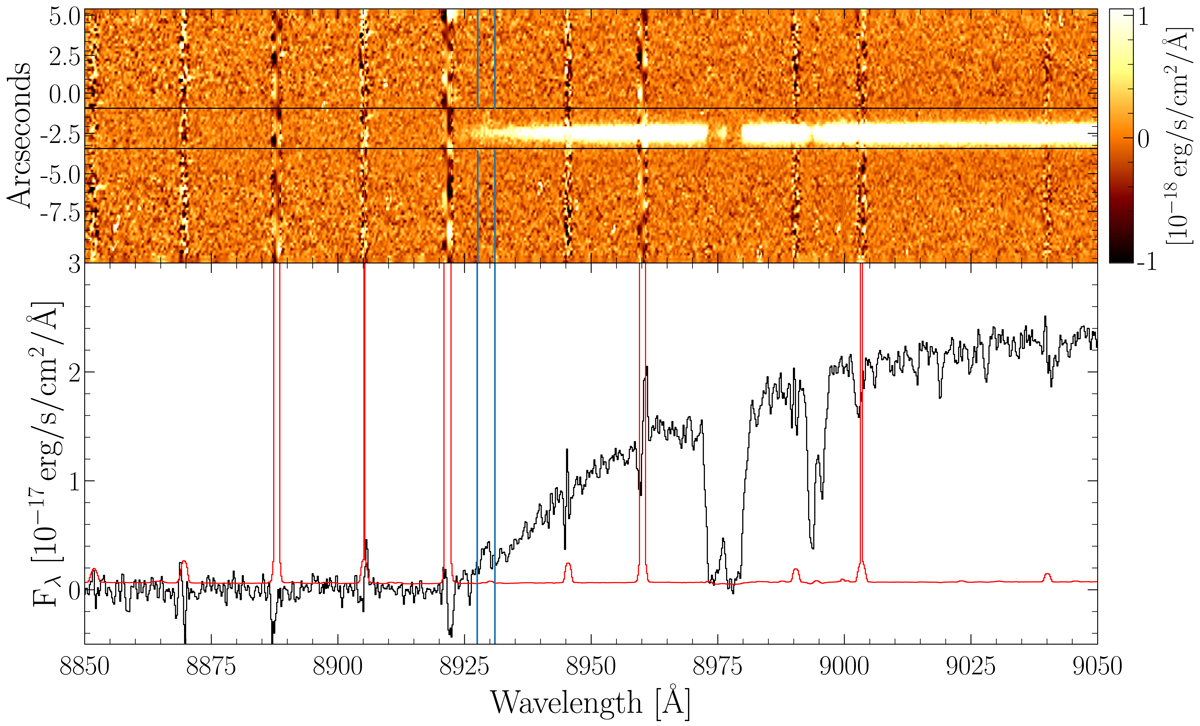
Tentative detection of Lyman-α emission at z = 6.3449. Upper panel: part of the X-shooter 2D spectrum. Wavelengths are reported in the observer frame. Lower panel: 1D spectrum corresponding to the extraction between the black horizontal lines of the 2D spectrum (from −0.8″ to −3.3″). In both panels the tentative Lyman-α emission detection is indicated by the blue lines surrounding it. The red line corresponds to the noise spectrum.
Current usage metrics show cumulative count of Article Views (full-text article views including HTML views, PDF and ePub downloads, according to the available data) and Abstracts Views on Vision4Press platform.
Data correspond to usage on the plateform after 2015. The current usage metrics is available 48-96 hours after online publication and is updated daily on week days.
Initial download of the metrics may take a while.