Fig. 3
Download original image
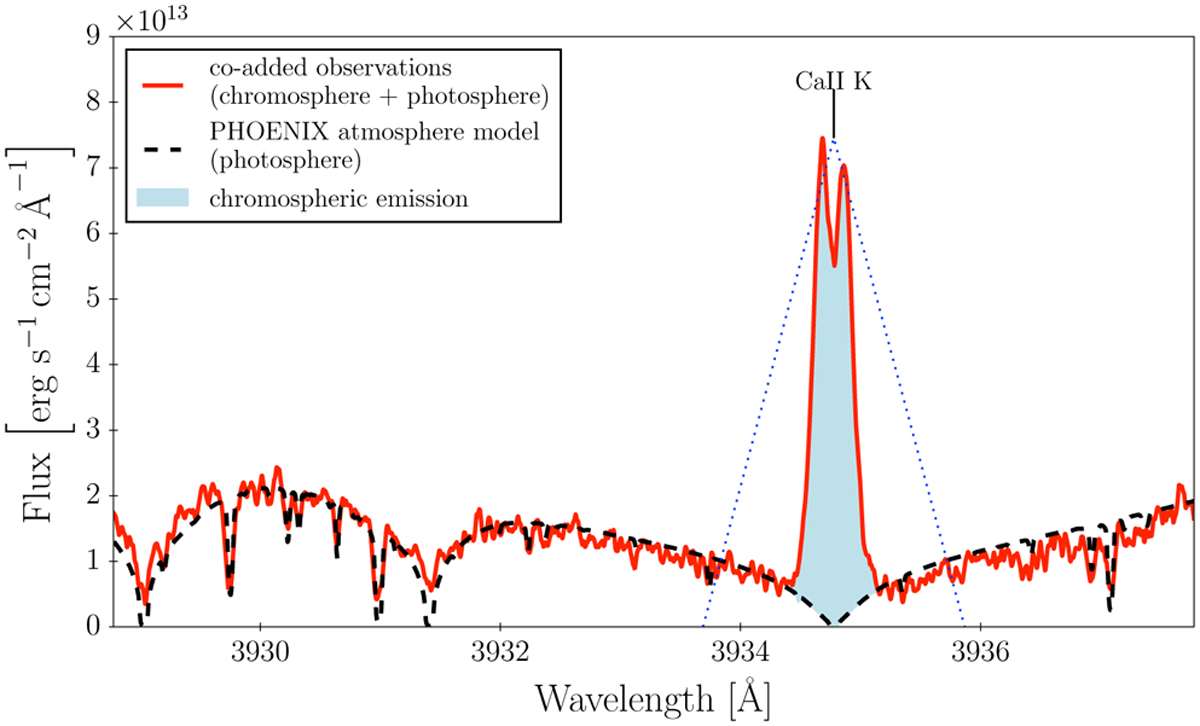
High S/N template spectrum of an early-M dwarf normalized to a PHOENIX atmosphere model. The solid red line is the high S/N template spectrum, while the dashed black line is the PHOENIX model atmosphere. The blue shaded region shows the chromospheric emission. The dotted lines indicate the 1.09 Å FWHM triangular bandpass used to integrate the Ca II H and K lines.
Current usage metrics show cumulative count of Article Views (full-text article views including HTML views, PDF and ePub downloads, according to the available data) and Abstracts Views on Vision4Press platform.
Data correspond to usage on the plateform after 2015. The current usage metrics is available 48-96 hours after online publication and is updated daily on week days.
Initial download of the metrics may take a while.