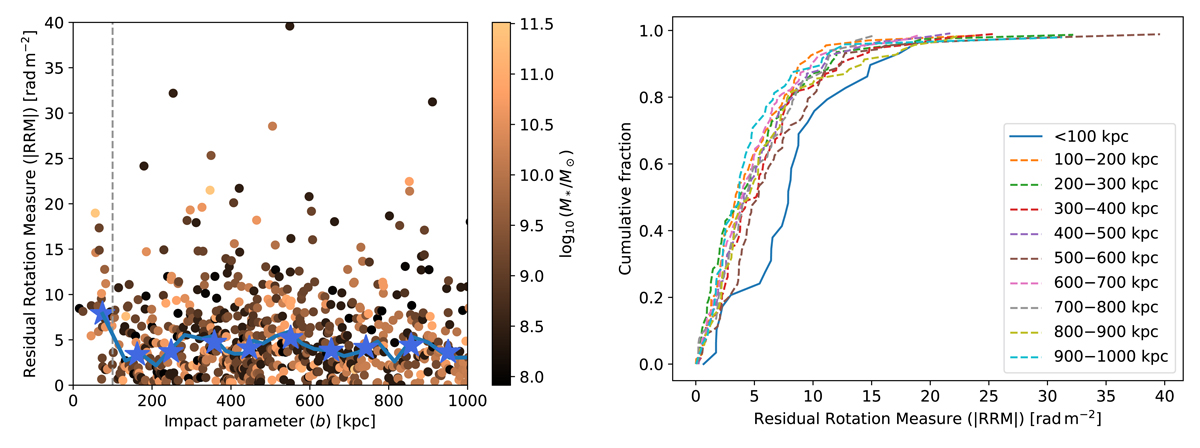
Fig. 2.
Download original image
Excess |RRM| at small impact parameters to the foreground galaxies. Left panel: |RRM| as a function of impact parameter for inclined galaxies (i ≥ 55°) where the background polarised source lies near the minor axis (|ϕ|< 45°). Data points are coloured according to the stellar mass of the foreground galaxy. Blue stars show the median |RRM| binned in 100 kpc intervals; the standard deviation is 0.57 ± 0.13 rad m−2 (b > 100 kpc) and 1.1 rad m−2 (b < 100 kpc). The solid blue line shows the running median of 29 binned data points, and the vertical dashed line is at b = 100 kpc. Right panel: cumulative distribution function of the |RRM| for sightlines binned into 100 kpc intervals. The solid blue line shows sightlines with b < 100 kpc, whereas the dashed coloured lines show them for b > 100 kpc.
Current usage metrics show cumulative count of Article Views (full-text article views including HTML views, PDF and ePub downloads, according to the available data) and Abstracts Views on Vision4Press platform.
Data correspond to usage on the plateform after 2015. The current usage metrics is available 48-96 hours after online publication and is updated daily on week days.
Initial download of the metrics may take a while.