Open Access
Fig. 3
Download original image
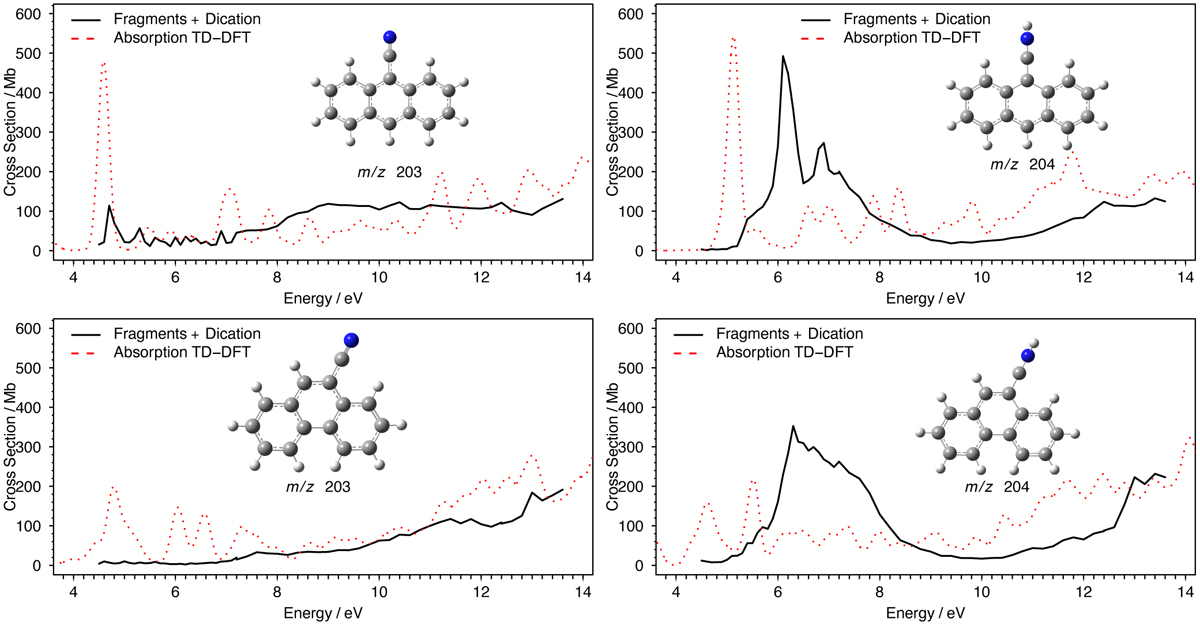
Black traces are the intensity of the photo-products (dications + singly ionized photofragments) as a function of VUV photon energy normalized to the photoabsorption cross section in the region [10–13.6 eV]. The red dashed lines are the theoretical photoabsorption spectra.
Current usage metrics show cumulative count of Article Views (full-text article views including HTML views, PDF and ePub downloads, according to the available data) and Abstracts Views on Vision4Press platform.
Data correspond to usage on the plateform after 2015. The current usage metrics is available 48-96 hours after online publication and is updated daily on week days.
Initial download of the metrics may take a while.