Fig. 8.
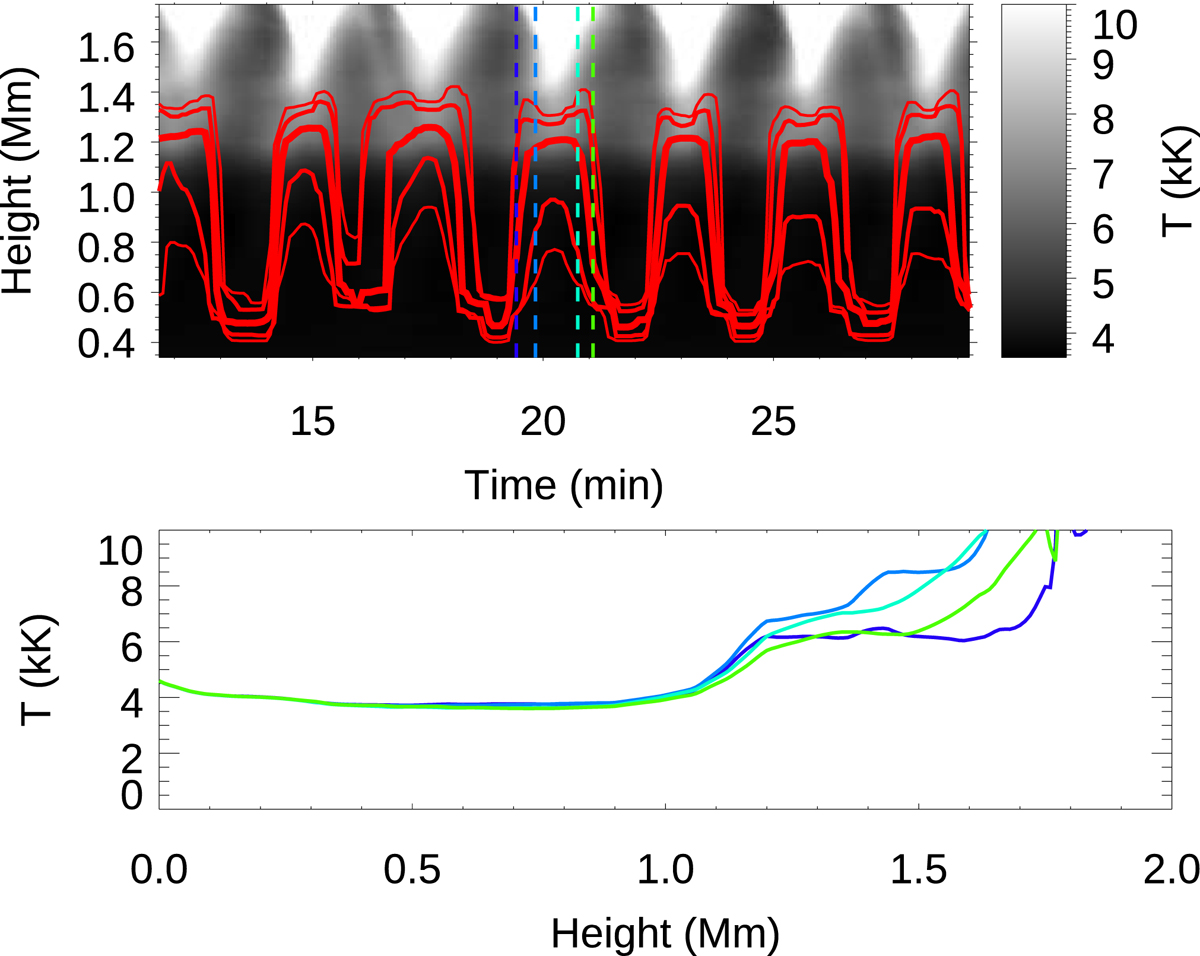
Download original image
Simulated temperature and the response of the Ca II 8542 Å line to temperature changes. Top panel: temperature as a function of height (vertical axis) and time (horizontal axis) at a randomly chosen spatial position. Red lines indicate the height of the peak of the response function of intensity to temperature (thickest line) and delimit the range of heights where the normalized response function is above 0.7 (medium-thick lines), and above 0.5 (thinner lines). Bottom panel: vertical stratification of the temperature at some selected time steps. The color of the line indicates the corresponding time step, as given by the dashed vertical lines in the top panel.
Current usage metrics show cumulative count of Article Views (full-text article views including HTML views, PDF and ePub downloads, according to the available data) and Abstracts Views on Vision4Press platform.
Data correspond to usage on the plateform after 2015. The current usage metrics is available 48-96 hours after online publication and is updated daily on week days.
Initial download of the metrics may take a while.