Fig. 6.
Download original image
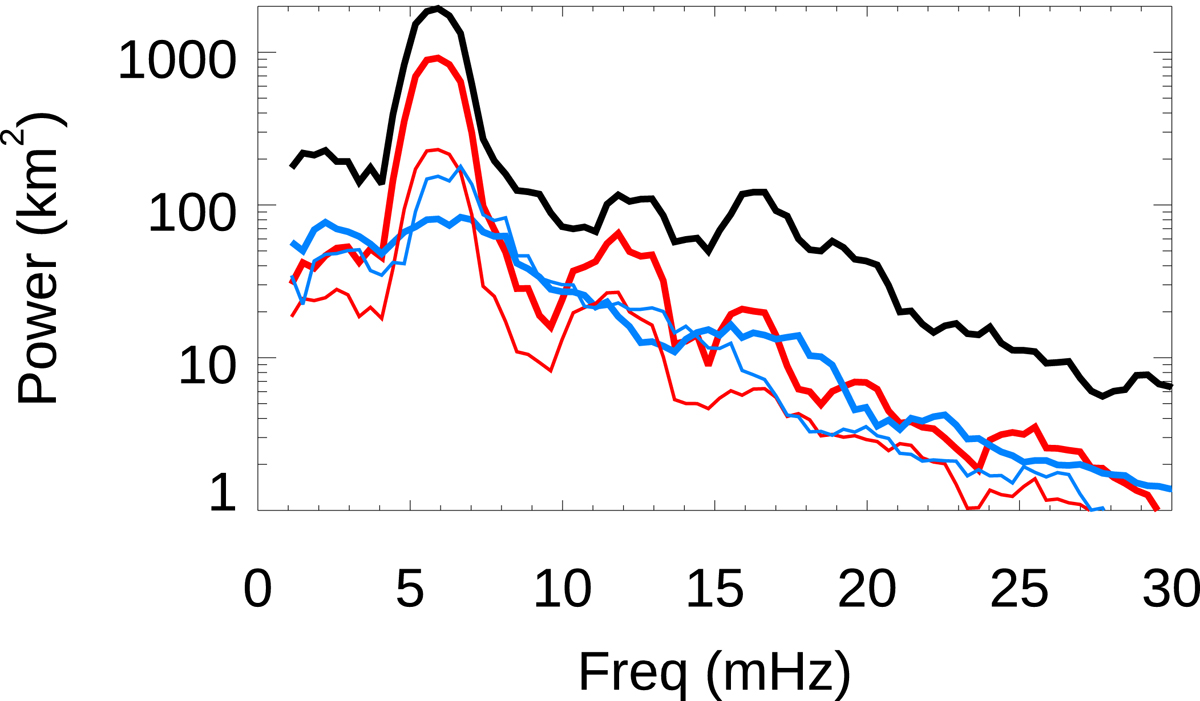
Power spectra of the formation height of the Ca II 8542 Å line averaged for all locations inside the umbra. The lines represent the maximum of the response function (black line), the minimum height where the response function of the intensity to velocity is above a selected threshold (red lines), and the maximum height where the response function is above the threshold (blue lines). The thickness of the colored lines indicates the threshold concerning the normalized response function, corresponding to 0.7, 0.5, and 0.3 from thicker to thinner.
Current usage metrics show cumulative count of Article Views (full-text article views including HTML views, PDF and ePub downloads, according to the available data) and Abstracts Views on Vision4Press platform.
Data correspond to usage on the plateform after 2015. The current usage metrics is available 48-96 hours after online publication and is updated daily on week days.
Initial download of the metrics may take a while.