Fig. 5.
Download original image
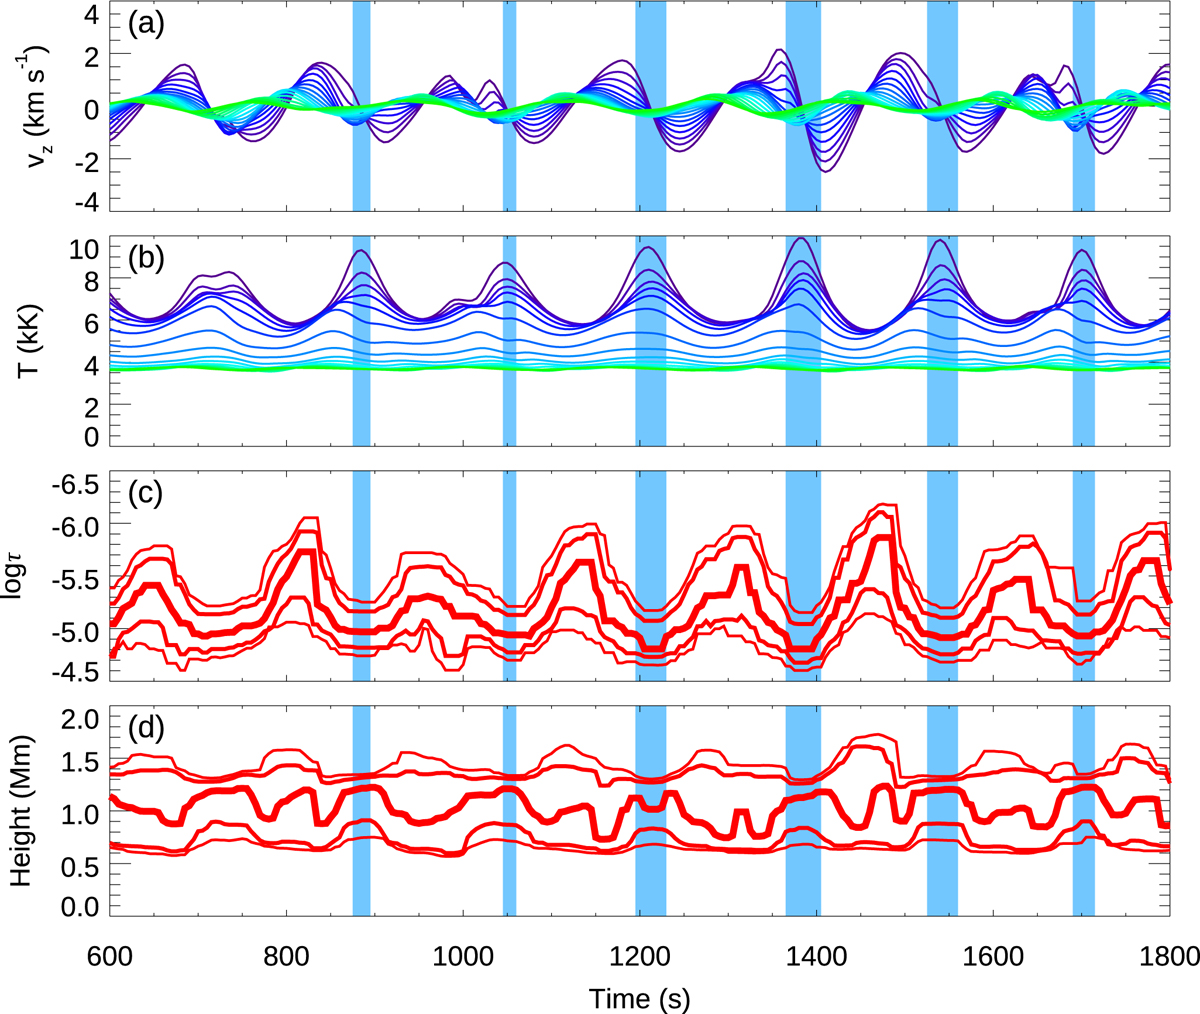
Oscillations in a randomly chosen location of the simulated umbra in the high chromosphere and low chromosphere (top two panels) and the regions where the Ca II 8542 Å intensity is sensitive to the velocity (bottom two panels). Top panels: temporal evolution of the vertical velocity (panel a) and temperature (middle panel) at constant geometrical heights. The colors have the same meaning as in Fig. 4. Bottom panels: illustrate the range of optical depths (panel c) or geometrical heights (panel d) where the Ca II 8542 Å intensity is sensitive to the velocity, as given by the examination of the response functions. The thickest lines indicate the layer where the response function is maximum. Thinner lines delimit the range of heights where the normalized response function is above a chosen threshold (0.5 for the thinnest pair of lines, 0.7 for the medium-thick lines). Blue-shaded regions indicate the times when the core of the line is in emission.
Current usage metrics show cumulative count of Article Views (full-text article views including HTML views, PDF and ePub downloads, according to the available data) and Abstracts Views on Vision4Press platform.
Data correspond to usage on the plateform after 2015. The current usage metrics is available 48-96 hours after online publication and is updated daily on week days.
Initial download of the metrics may take a while.