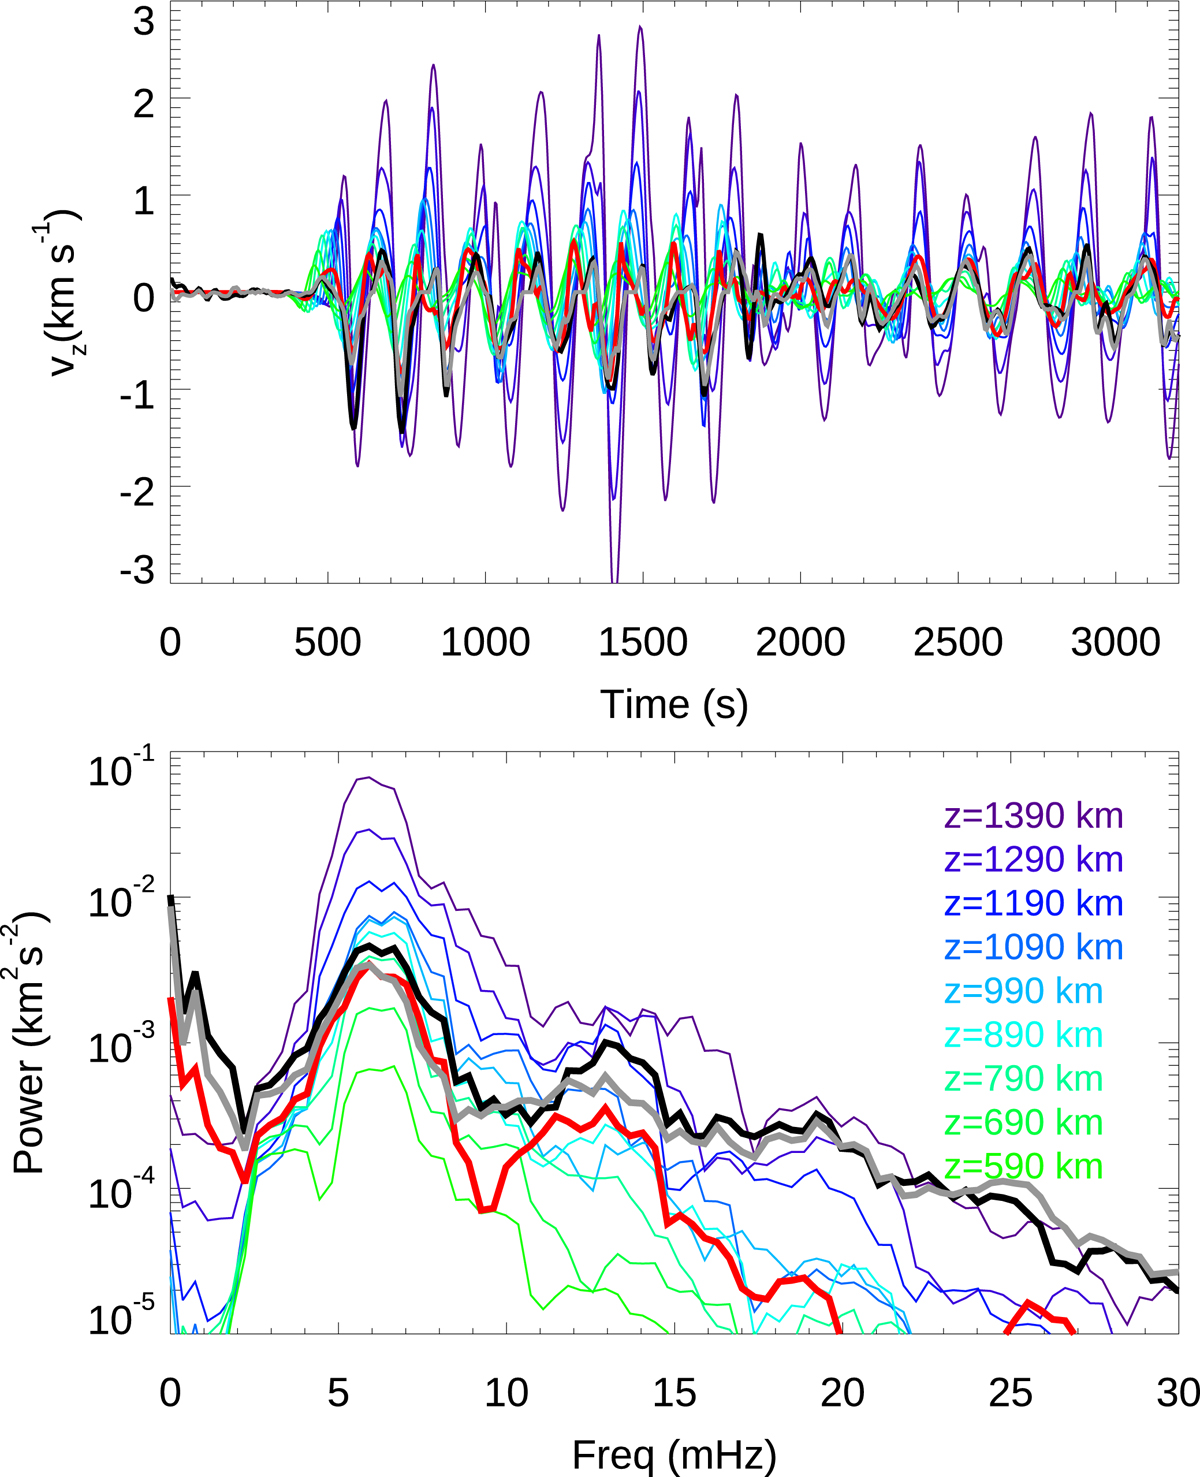
Fig. 4.
Download original image
Comparison between velocity oscillations in geometrical scale, optical depth, and those inferred from the inversion of synthetic Ca II 8542 Å profiles. Top panel: temporal evolution of the vertical velocity at a randomly chosen spatial position. Bottom panel: power spectra of the vertical velocity averaged for all the spatial position from the numerical simulation. In both panels, the black lines correspond to the velocity inferred from inversions of the synthetic profiles with one node in velocity, the gray lines indicate the velocity inferred from inversions with three nodes in velocity averaged in log τ = [ − 4.8, −5.4], and the red lines correspond to the actual velocity from the simulations averaged in the same range of optical depths. Colored lines with a gradient of green-blue-violet represent the velocity (top panel) and power spectra (bottom panel) at constant geometrical height; they span from z = 590 km to z = 1390 km, which is approximately the range of geometrical heights where the Ca II 8542 Å line is sensitive to the velocity (Fig. 3), with a step of 100 km between consecutive lines. The legend in the bottom panel indicates the heights corresponding to some colors as a reference.
Current usage metrics show cumulative count of Article Views (full-text article views including HTML views, PDF and ePub downloads, according to the available data) and Abstracts Views on Vision4Press platform.
Data correspond to usage on the plateform after 2015. The current usage metrics is available 48-96 hours after online publication and is updated daily on week days.
Initial download of the metrics may take a while.