Fig. 3.
Download original image
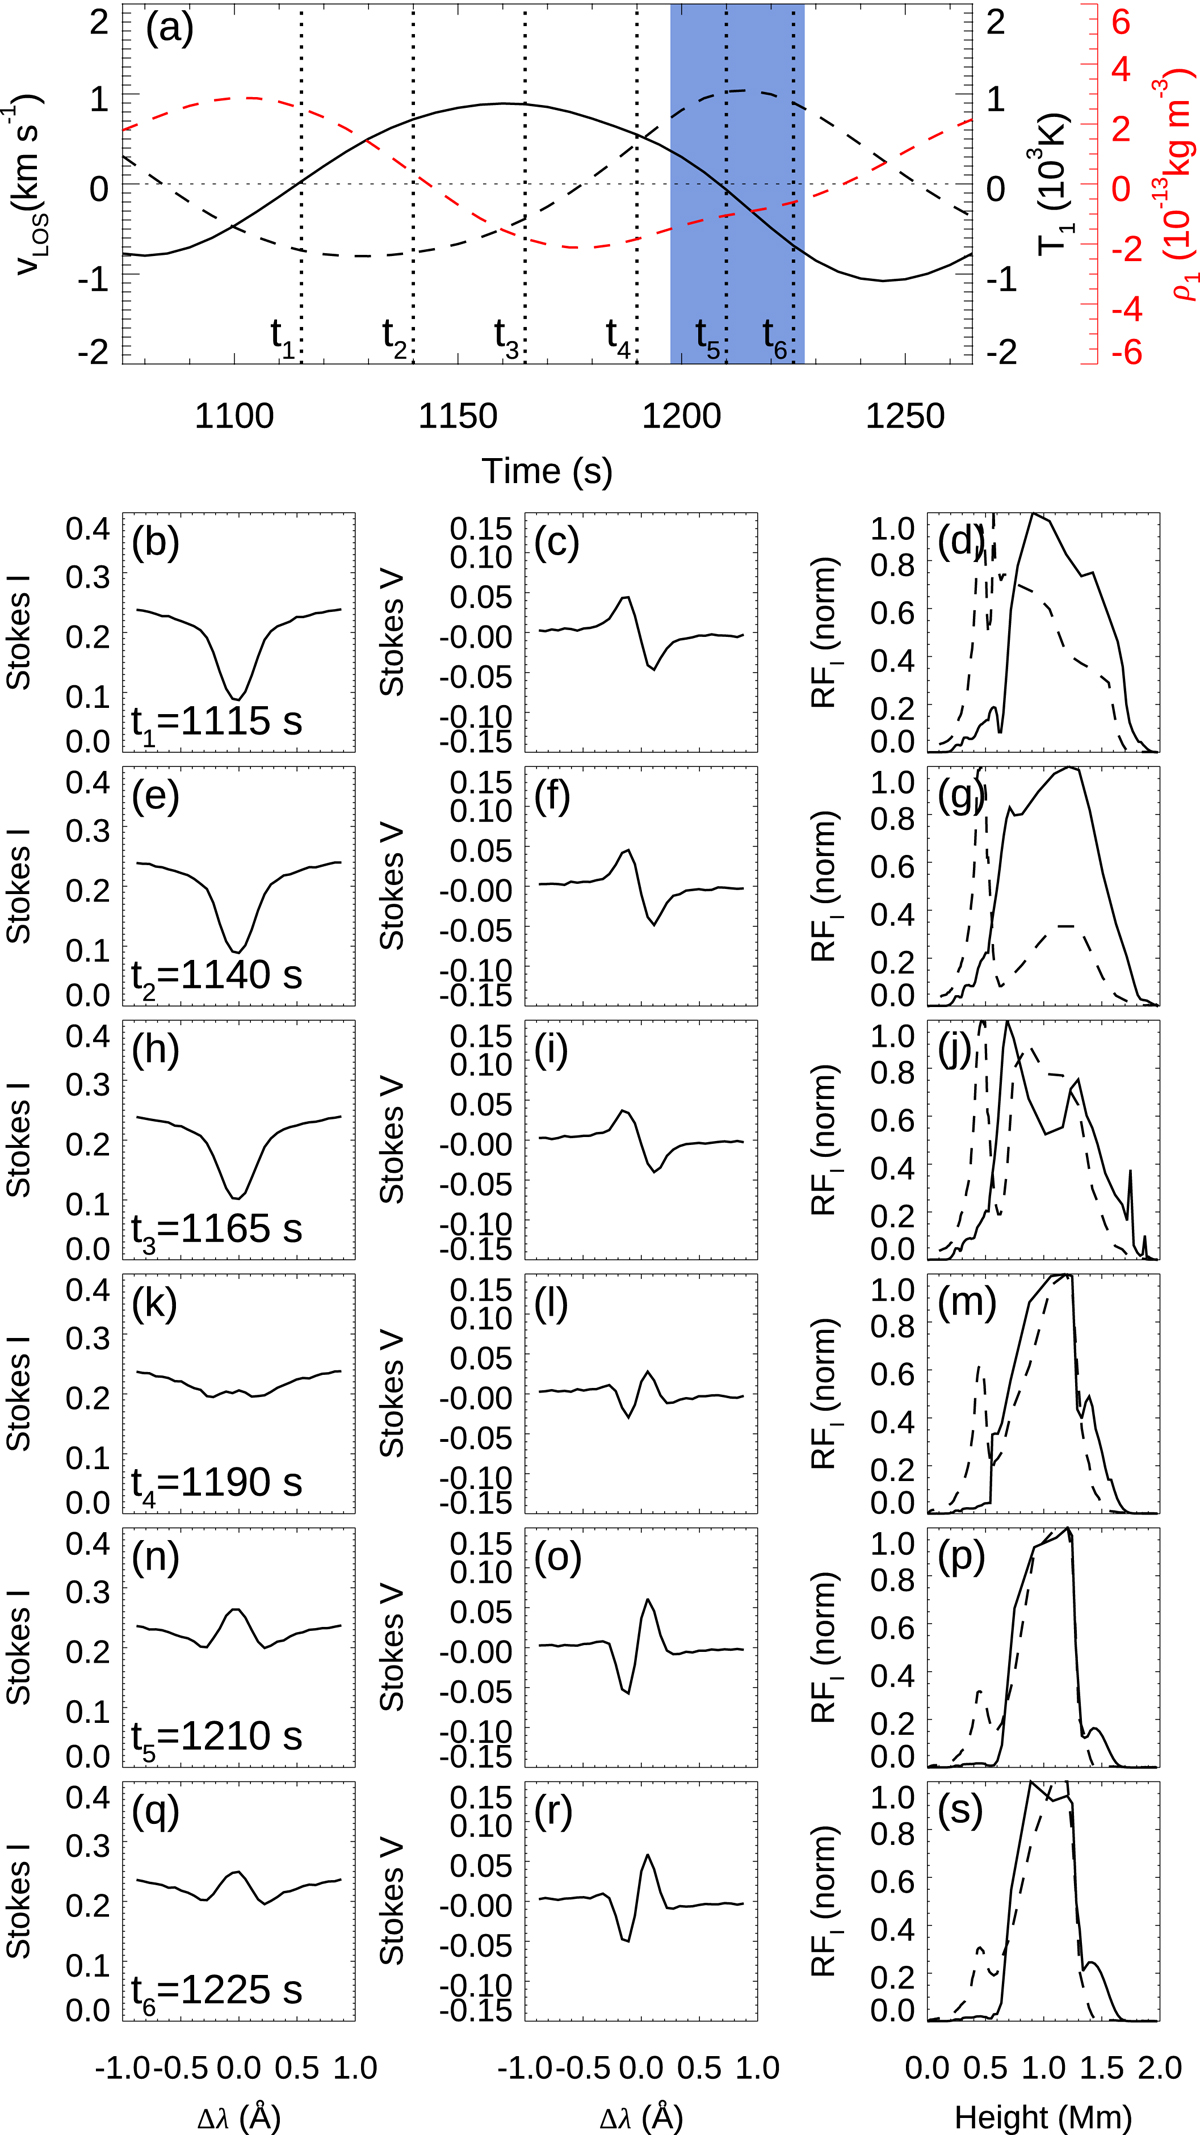
Temporal evolution of a synthetic umbral flash in Ca II 8542 Å. Panel a: vertical velocity (black solid line, left axis), temperature perturbation (black dashed line, right axis), and density perturbation (red dashed line, red right axis) as a function of time. The blue-shaded area denotes the times when the core of the line is in emission. Vertical dotted lines indicate the time steps plotted in panels b–s. Bottom panels: Stokes I (left column), Stokes V (middle column), and response functions of the intensity to velocity (solid line) and temperature (dashed line) as a function of geometrical height (right column). Each row corresponds to the time shown in the left column and indicated by vertical dotted lines in panel a.
Current usage metrics show cumulative count of Article Views (full-text article views including HTML views, PDF and ePub downloads, according to the available data) and Abstracts Views on Vision4Press platform.
Data correspond to usage on the plateform after 2015. The current usage metrics is available 48-96 hours after online publication and is updated daily on week days.
Initial download of the metrics may take a while.