Open Access
Fig. 5.
Download original image
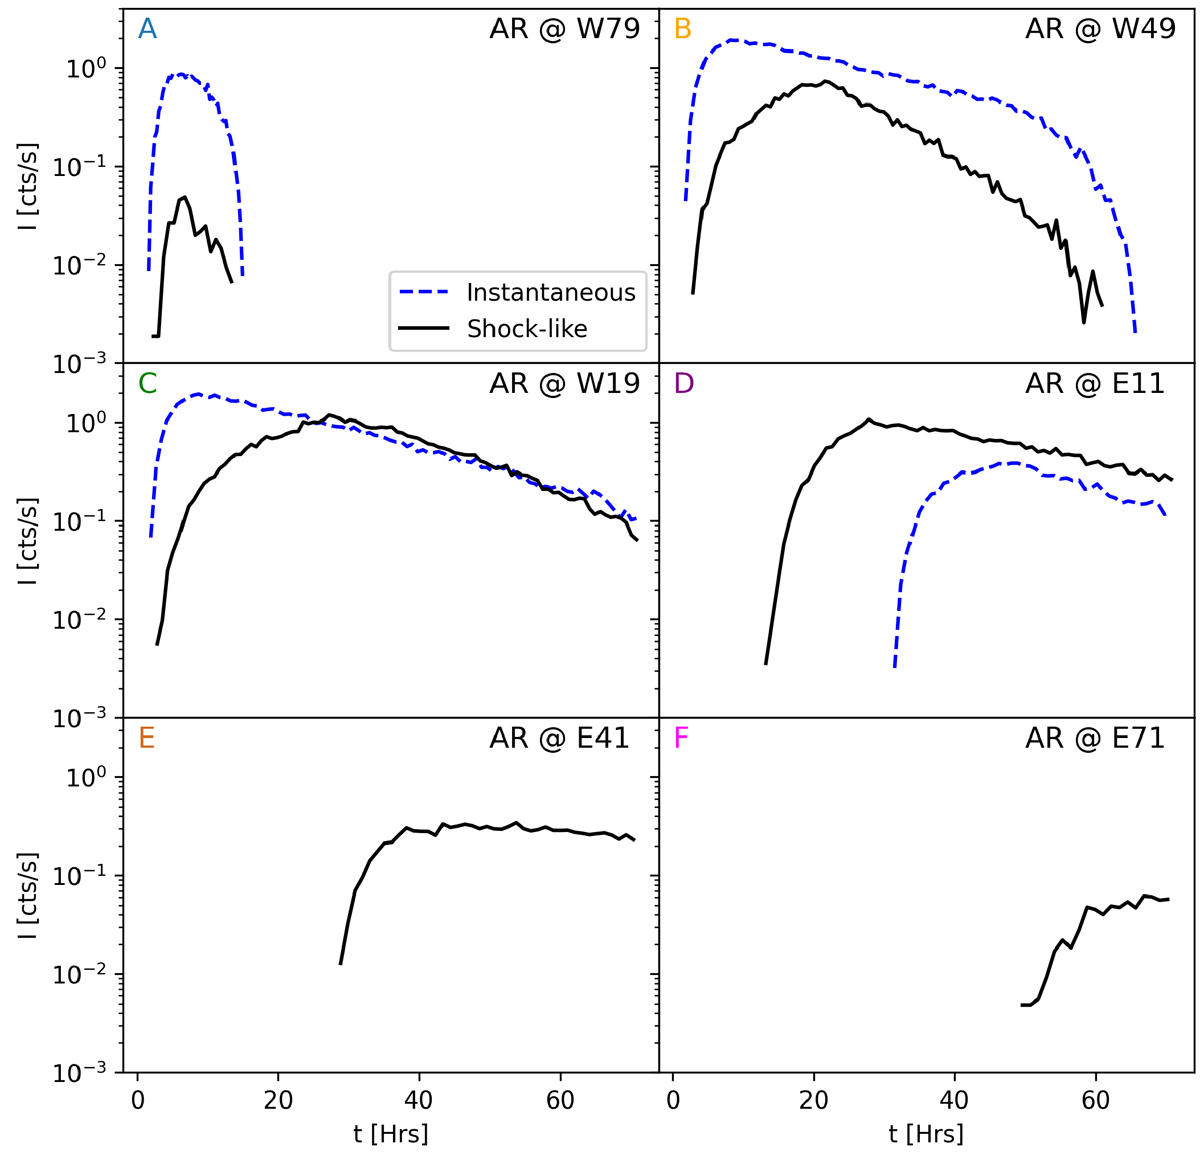
Intensity profiles for observers A–F considering an instantaneous injection (blue dashed lines) and an extended uniform injection (solid black lines) with respect to r, θ, and ϕ. The injection region is 70° in both cases. The simulations use λ = 0.1 au.
Current usage metrics show cumulative count of Article Views (full-text article views including HTML views, PDF and ePub downloads, according to the available data) and Abstracts Views on Vision4Press platform.
Data correspond to usage on the plateform after 2015. The current usage metrics is available 48-96 hours after online publication and is updated daily on week days.
Initial download of the metrics may take a while.