Fig. 3.
Download original image
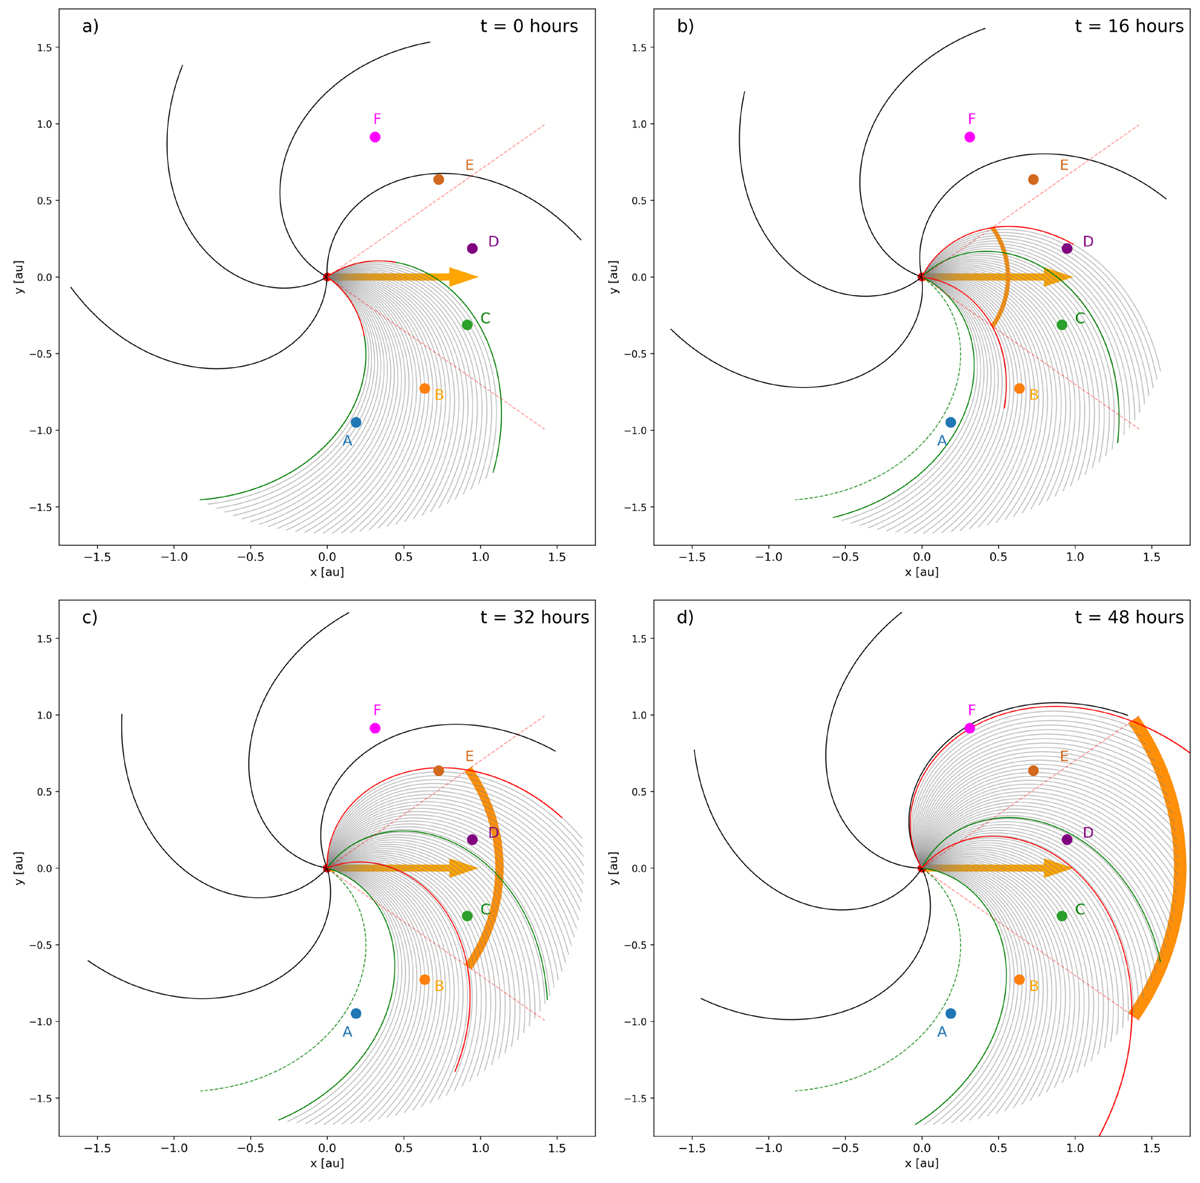
Diagrams showing the shock position and observer geometry at t = 0 (top left), 16 (top right), 32 (bottom left), and 48 (bottom right) hours projected onto the solar equatorial plane. Here x and y are heliocentric Cartesian coordinates in the heliographic equatorial plane. The shock’s projection onto the plane is displayed here as the orange shaded segments. Observers A-F are denoted by the coloured circles, and their exact positions are displayed in Table 2. The red radial dashed lines delimit the bounds of the shock, and the solid red curved lines show the IMF lines that are currently connected to the flanks of the shock front. The solid green curved lines show the bounds of the shock-like injection at the initial time (or equally an instantaneous injection at the Sun of the same angular width). The dashed green line shows the original position of the left most solid green line at the initial time. The grey IMF lines represent the range of IMF lines that have had particles injected onto them (the particle-filled flux tubes).
Current usage metrics show cumulative count of Article Views (full-text article views including HTML views, PDF and ePub downloads, according to the available data) and Abstracts Views on Vision4Press platform.
Data correspond to usage on the plateform after 2015. The current usage metrics is available 48-96 hours after online publication and is updated daily on week days.
Initial download of the metrics may take a while.