Open Access
Fig. 7.
Download original image
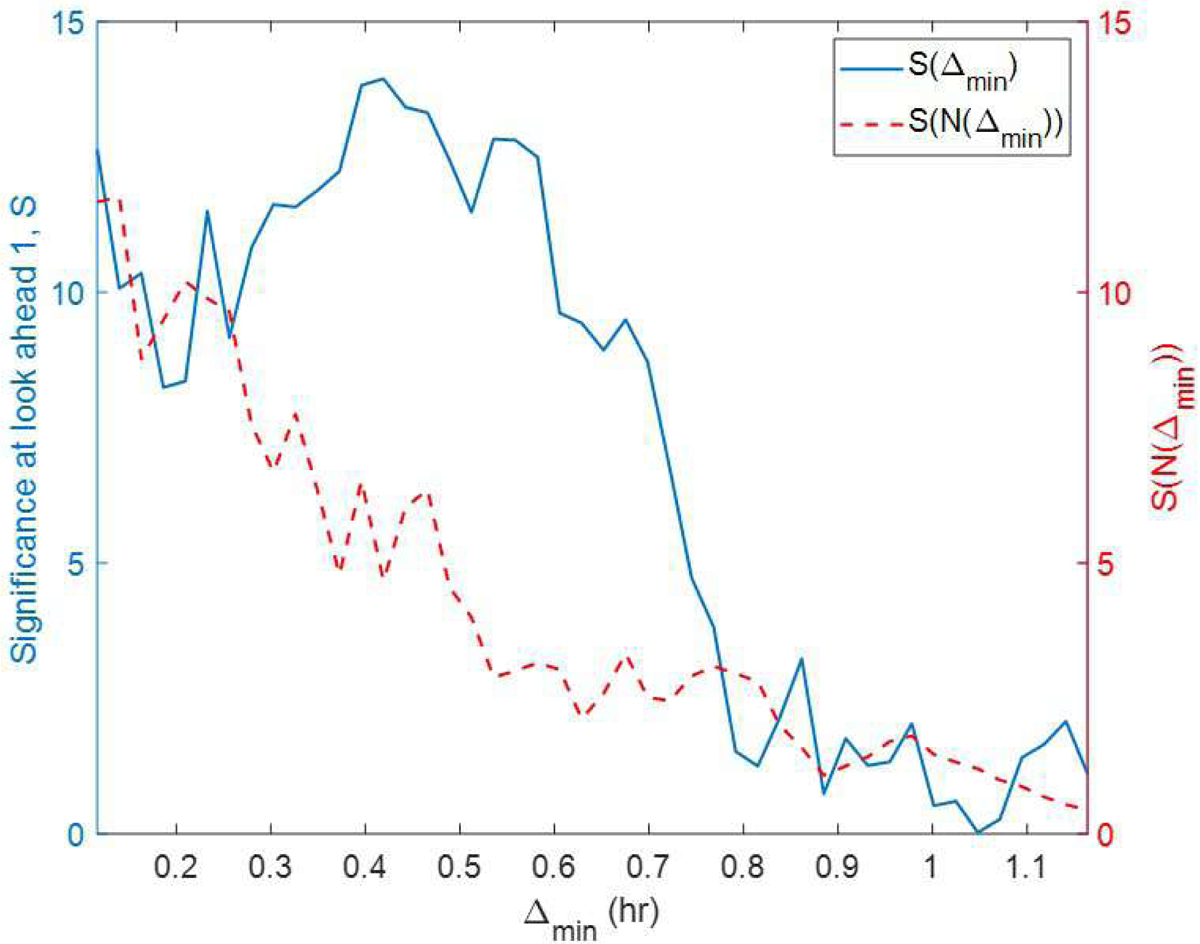
Significance of successive events (m = 1) for a given value of Δmin (blue curve), and significance for a given value of Δmin if the decrease in significance is only a result of a decrease in the amount of data (dashed red curve).
Current usage metrics show cumulative count of Article Views (full-text article views including HTML views, PDF and ePub downloads, according to the available data) and Abstracts Views on Vision4Press platform.
Data correspond to usage on the plateform after 2015. The current usage metrics is available 48-96 hours after online publication and is updated daily on week days.
Initial download of the metrics may take a while.