Fig. 4.
Download original image
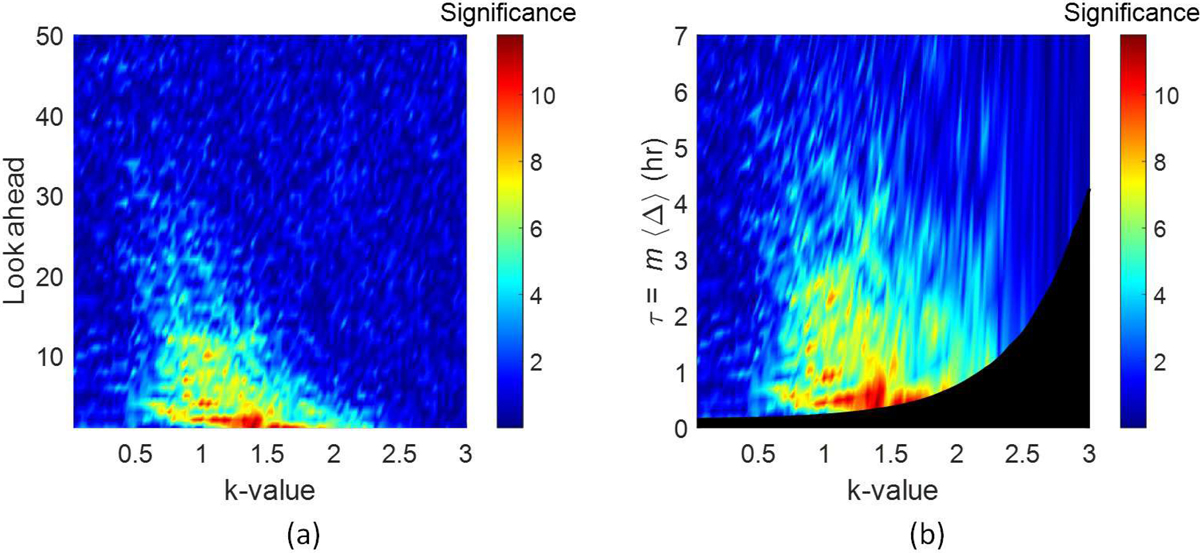
Contour plots showing (a) significance vs. look ahead vs. k-value and (b) significance as a function of τ vs. k-value (where τ is obtained by multiplying the average waiting time based on that k-value by m). The lower boundary of this plot corresponds to m = 1 and also shows how the average waiting time depends on the k-value. The hashed region in the lower right is masked because we only analyze the mutual information for m ≥ 1. It is apparent that the information horizon detected between k = 0.6 and k = 2.4 appears to be consistent in duration (around 5 h), suggestive of an underlying dynamics that is independent of the threshold value.
Current usage metrics show cumulative count of Article Views (full-text article views including HTML views, PDF and ePub downloads, according to the available data) and Abstracts Views on Vision4Press platform.
Data correspond to usage on the plateform after 2015. The current usage metrics is available 48-96 hours after online publication and is updated daily on week days.
Initial download of the metrics may take a while.