Open Access
Fig. 1.
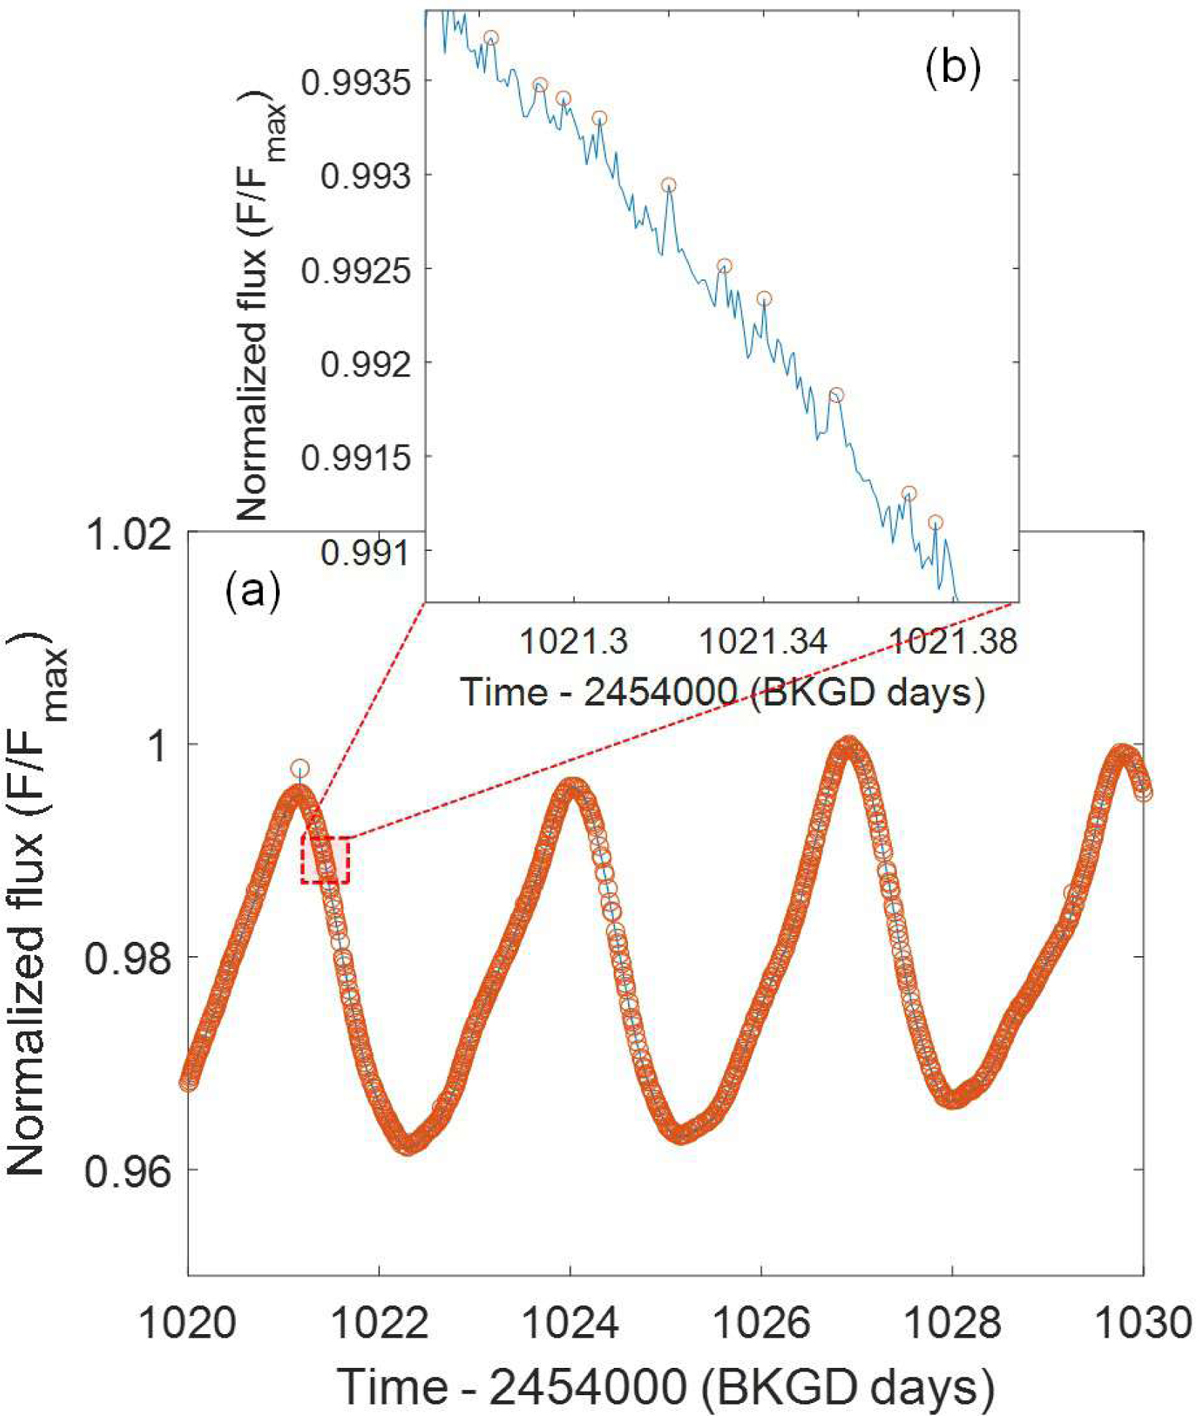
Download original image
Light curve for KIC 7985370. (a) Application of our flare selection criteria applied to the data with k = 1.56; flare events are shown as open orange circles. (b) Zoomed-in view of the group of flares in the red shaded box.
Current usage metrics show cumulative count of Article Views (full-text article views including HTML views, PDF and ePub downloads, according to the available data) and Abstracts Views on Vision4Press platform.
Data correspond to usage on the plateform after 2015. The current usage metrics is available 48-96 hours after online publication and is updated daily on week days.
Initial download of the metrics may take a while.