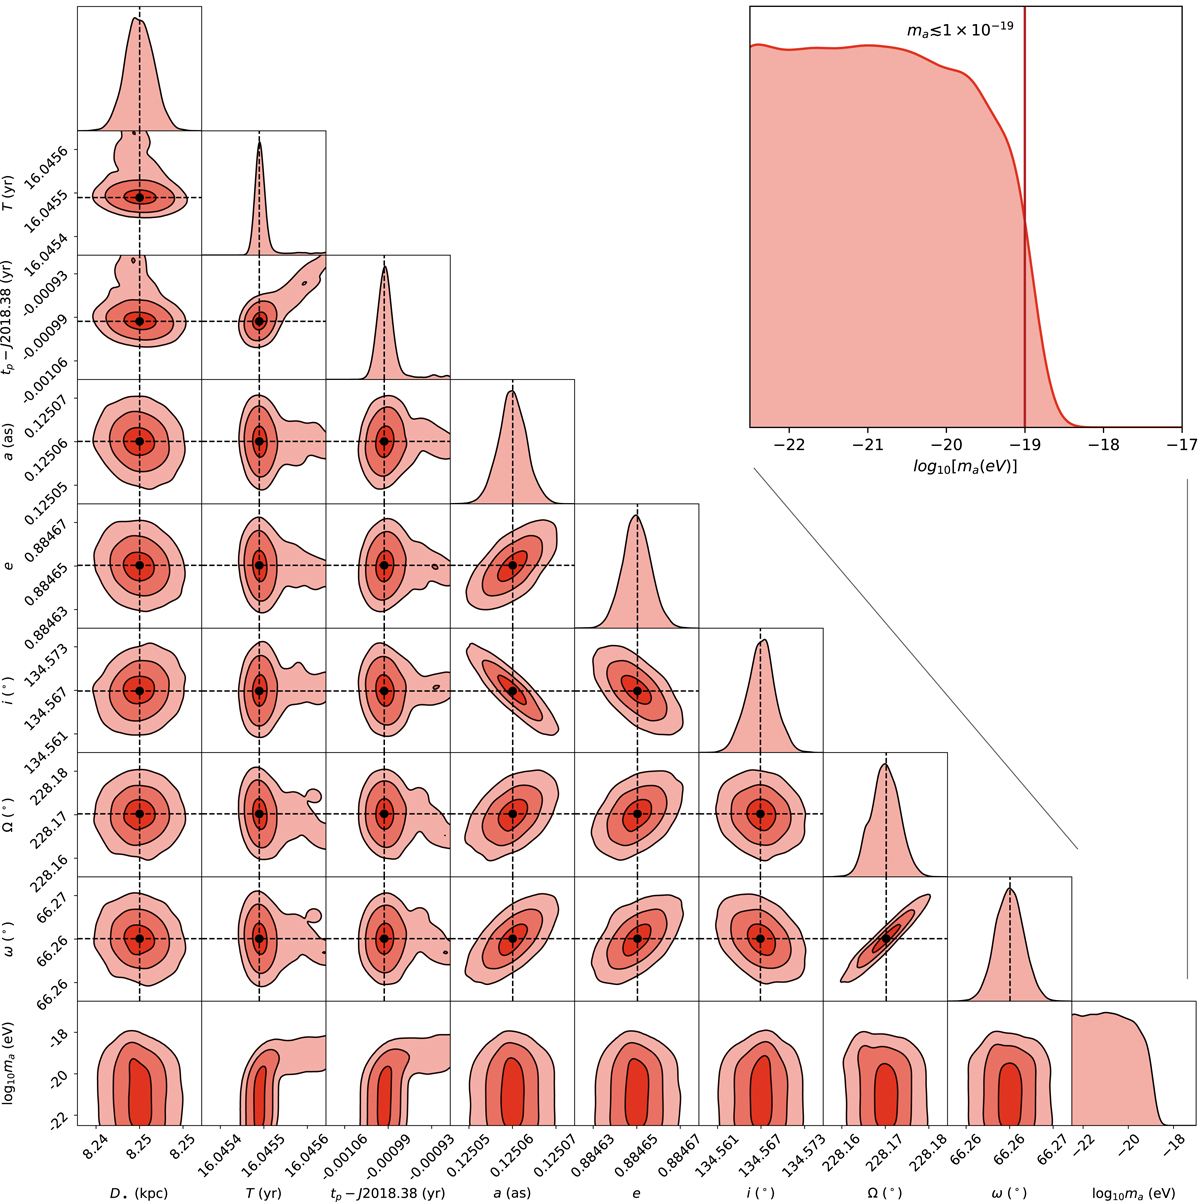
Fig. E.1.
Download original image
9D posterior distribution resulting from the MCMC analysis. Contours report the 68%, 95%, and 99.7% regions on each pair of parameters, while the density plot on top of each column report the single-parameter marginalized distribution. All the parameters of our orbital model are bound and show closed contours, with the exception of ma for which we can only set an upper limit from our analysis. The black dashed lines and filled circles show the input parameters used to build the mock catalog. The inset reports the marginalized posterior distribution of the parameter, ma, in the logarithmic scale. The red vertical line corresponds to the 95% upper limit of the parameter resulting from our posterior analysis.
Current usage metrics show cumulative count of Article Views (full-text article views including HTML views, PDF and ePub downloads, according to the available data) and Abstracts Views on Vision4Press platform.
Data correspond to usage on the plateform after 2015. The current usage metrics is available 48-96 hours after online publication and is updated daily on week days.
Initial download of the metrics may take a while.