Fig. 8
Download original image
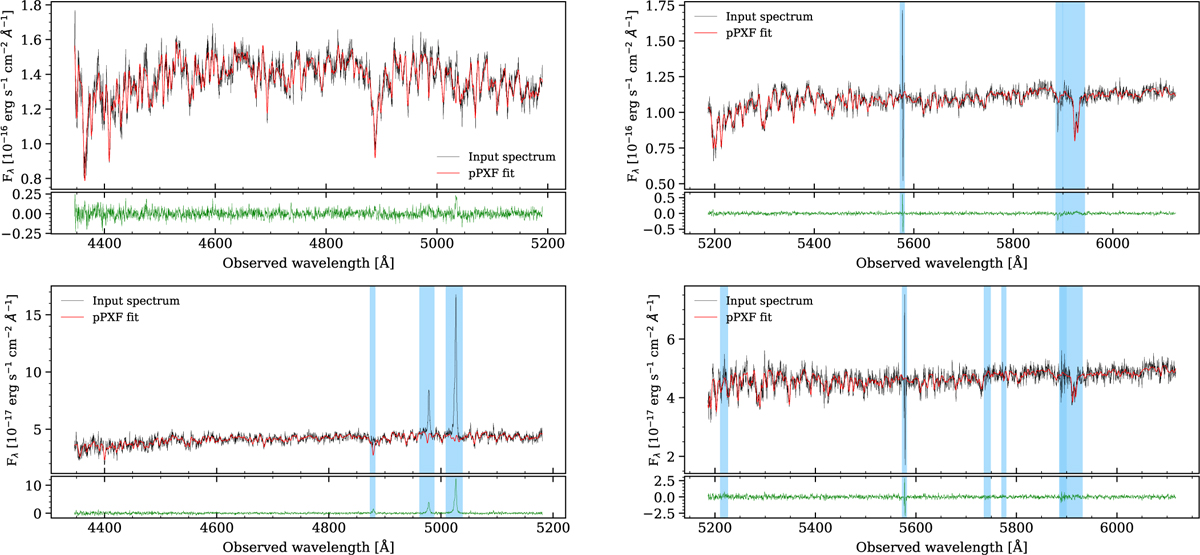
Examples of stellar continuum fitting using pPXF for 2 galaxies of the sample. Top left panel: NGC 0718 spectrum in the LR-B spectral range. Top right panel: NGC 0718 spectrum in the LR-V spectral range. Bottom left panel: NGC 3982 spectrum in the LR-B spectral range. Bottom right panel: NGC 3982 spectrum in the LR-V spectral range. The black lines show the original spectrum observed with MEGARA for these spaxels. The red lines are the best fit performed by pPXF on the data. The green lines are the residuals resulting from subtracting the best model from the original data. The vertical blue regions are areas that were masked during the fitting.
Current usage metrics show cumulative count of Article Views (full-text article views including HTML views, PDF and ePub downloads, according to the available data) and Abstracts Views on Vision4Press platform.
Data correspond to usage on the plateform after 2015. The current usage metrics is available 48-96 hours after online publication and is updated daily on week days.
Initial download of the metrics may take a while.