Fig. 7
Download original image
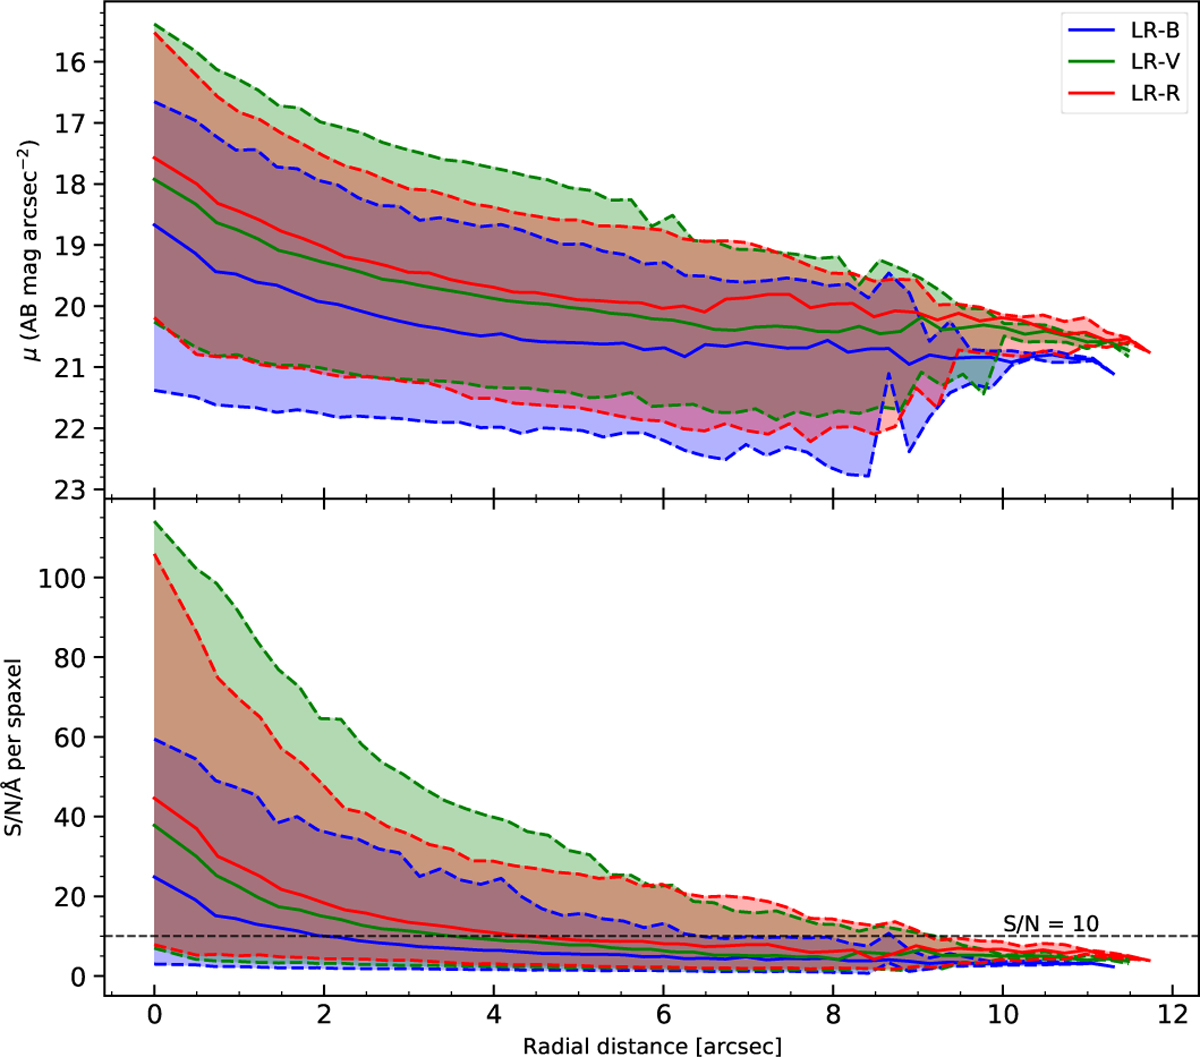
Surface AB magnitude per spaxel and signal-to-noise ratio per Angstrom as a function of distance to the brightest spaxel for all spaxels in the MEGADES sample separated by VPH. Top panel: Surface AB magnitude per spaxel for all the spaxels in the sample as a function of the distance. In both cases, the solid lines represent the median S/N value for each distance and VPH, and the dashed lines encompass the 5th and 95th percentiles for each of them. Blue, green, and red correspond to the measurements for the LR-B, LR-V, and LR-R observations, respectively. Bottom panel: Signal-to-noise ratio per Angstrom of all the spaxels in the sample as a function of the distance. The dashed horizontal line identifies the S/N 10 value.
Current usage metrics show cumulative count of Article Views (full-text article views including HTML views, PDF and ePub downloads, according to the available data) and Abstracts Views on Vision4Press platform.
Data correspond to usage on the plateform after 2015. The current usage metrics is available 48-96 hours after online publication and is updated daily on week days.
Initial download of the metrics may take a while.