Fig. 5
Download original image
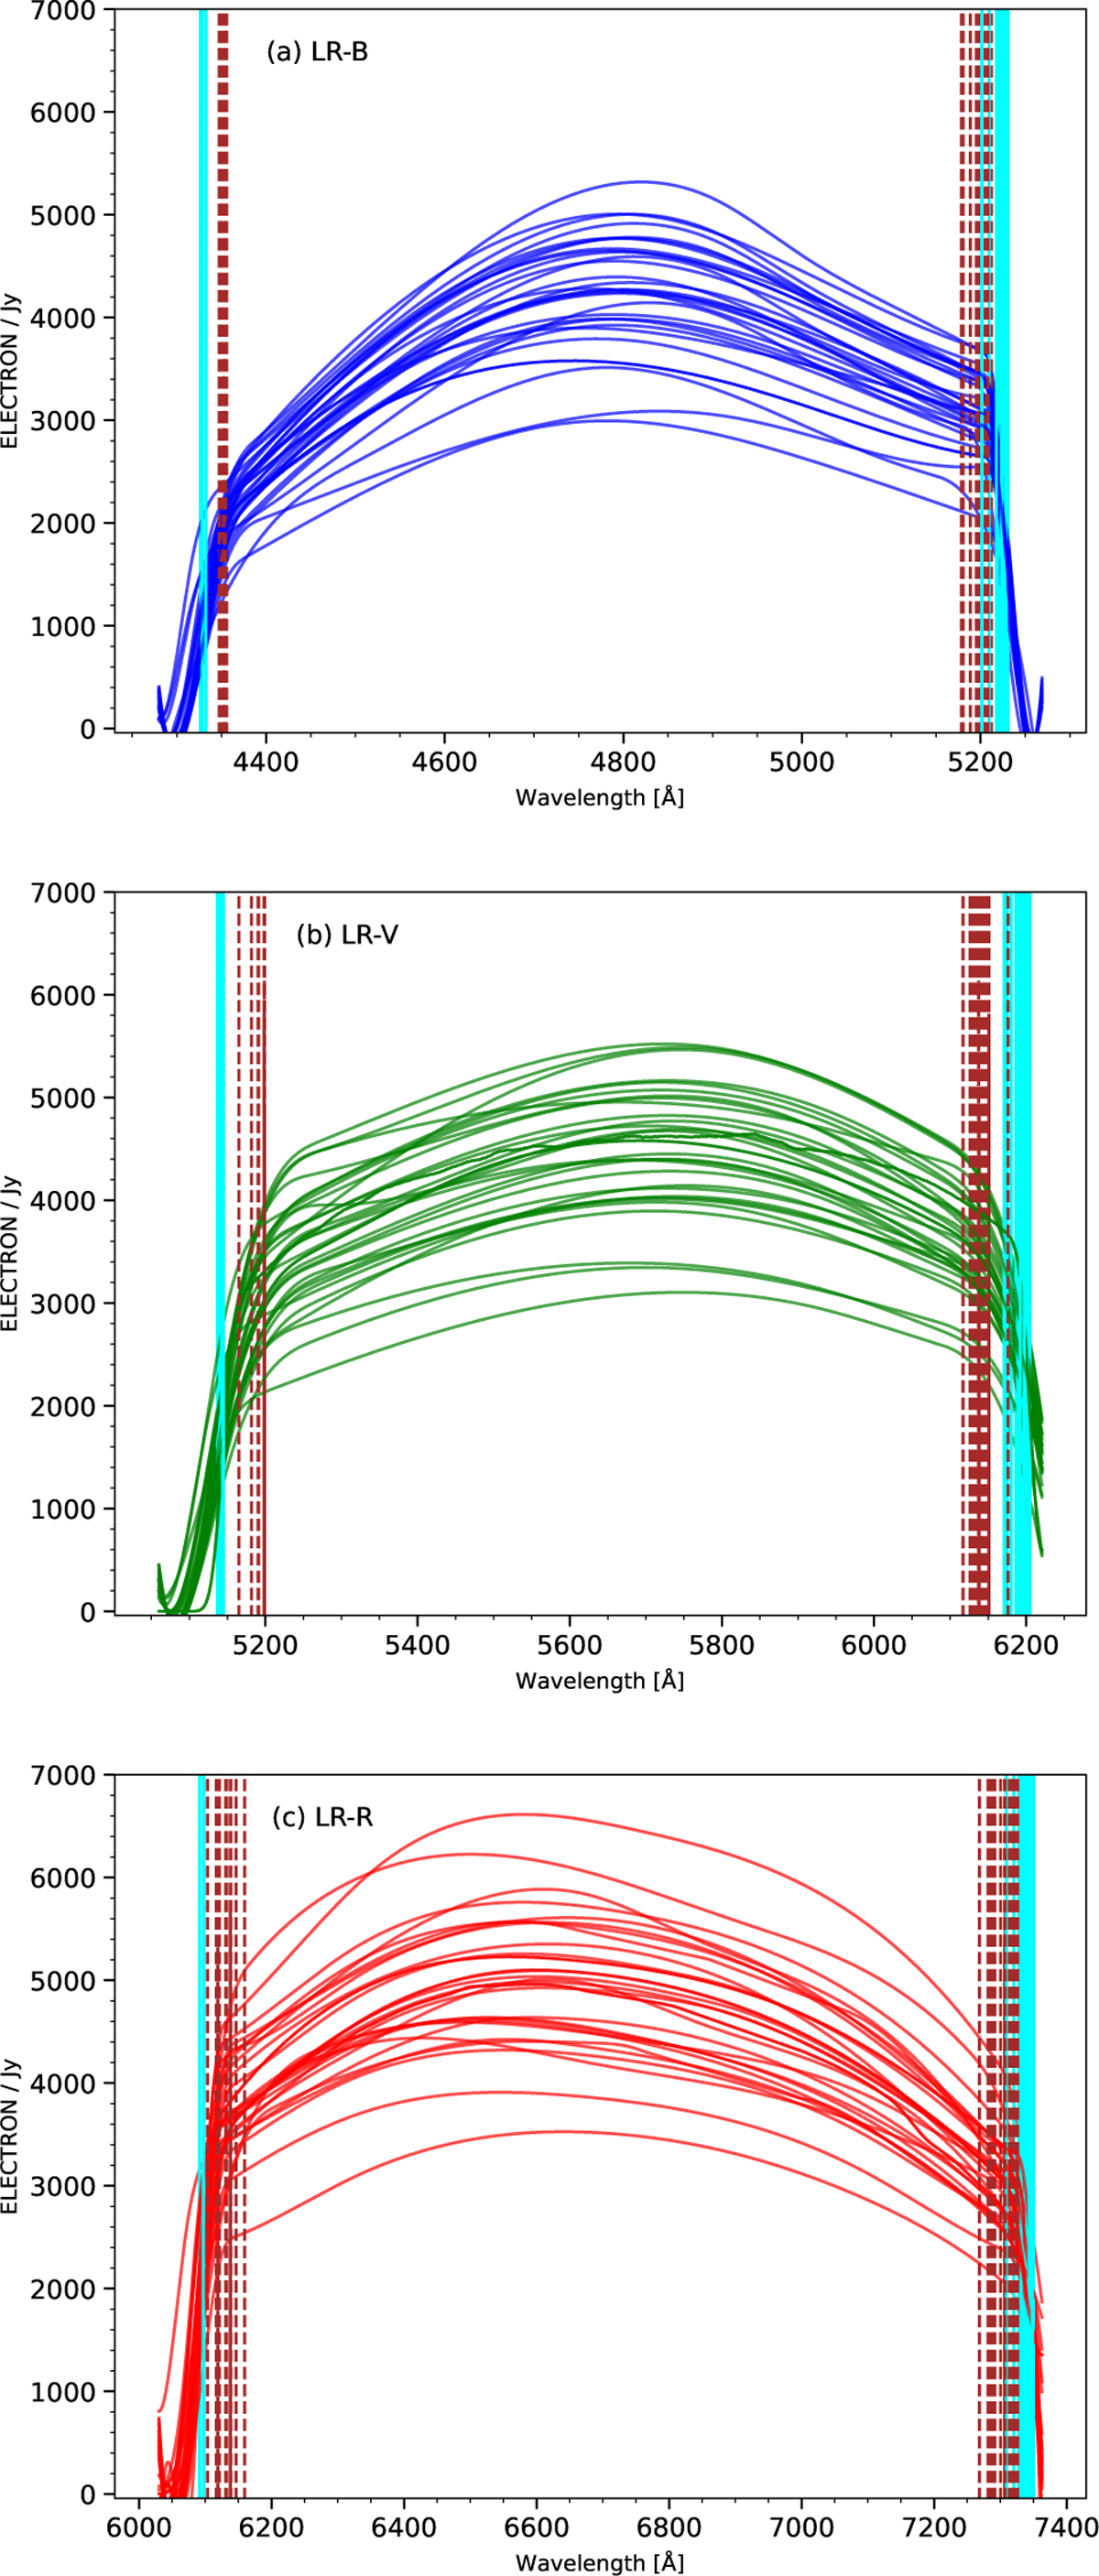
Sensitivity curves for the flux calibration of all MEGADES observations. Panels a, b, and c show the sensitivity curves derived from all the standard stars observed with the LR-B, LR-V, and LR-R gratings, respectively. Cyan lines mark the spectral coverage after flux calibration in Angstroms for all fibres. Dashed brown lines indicate the spectral coverage after flux calibration in Angstroms, with a proper flux calibration.
Current usage metrics show cumulative count of Article Views (full-text article views including HTML views, PDF and ePub downloads, according to the available data) and Abstracts Views on Vision4Press platform.
Data correspond to usage on the plateform after 2015. The current usage metrics is available 48-96 hours after online publication and is updated daily on week days.
Initial download of the metrics may take a while.