Fig. 2.
Download original image
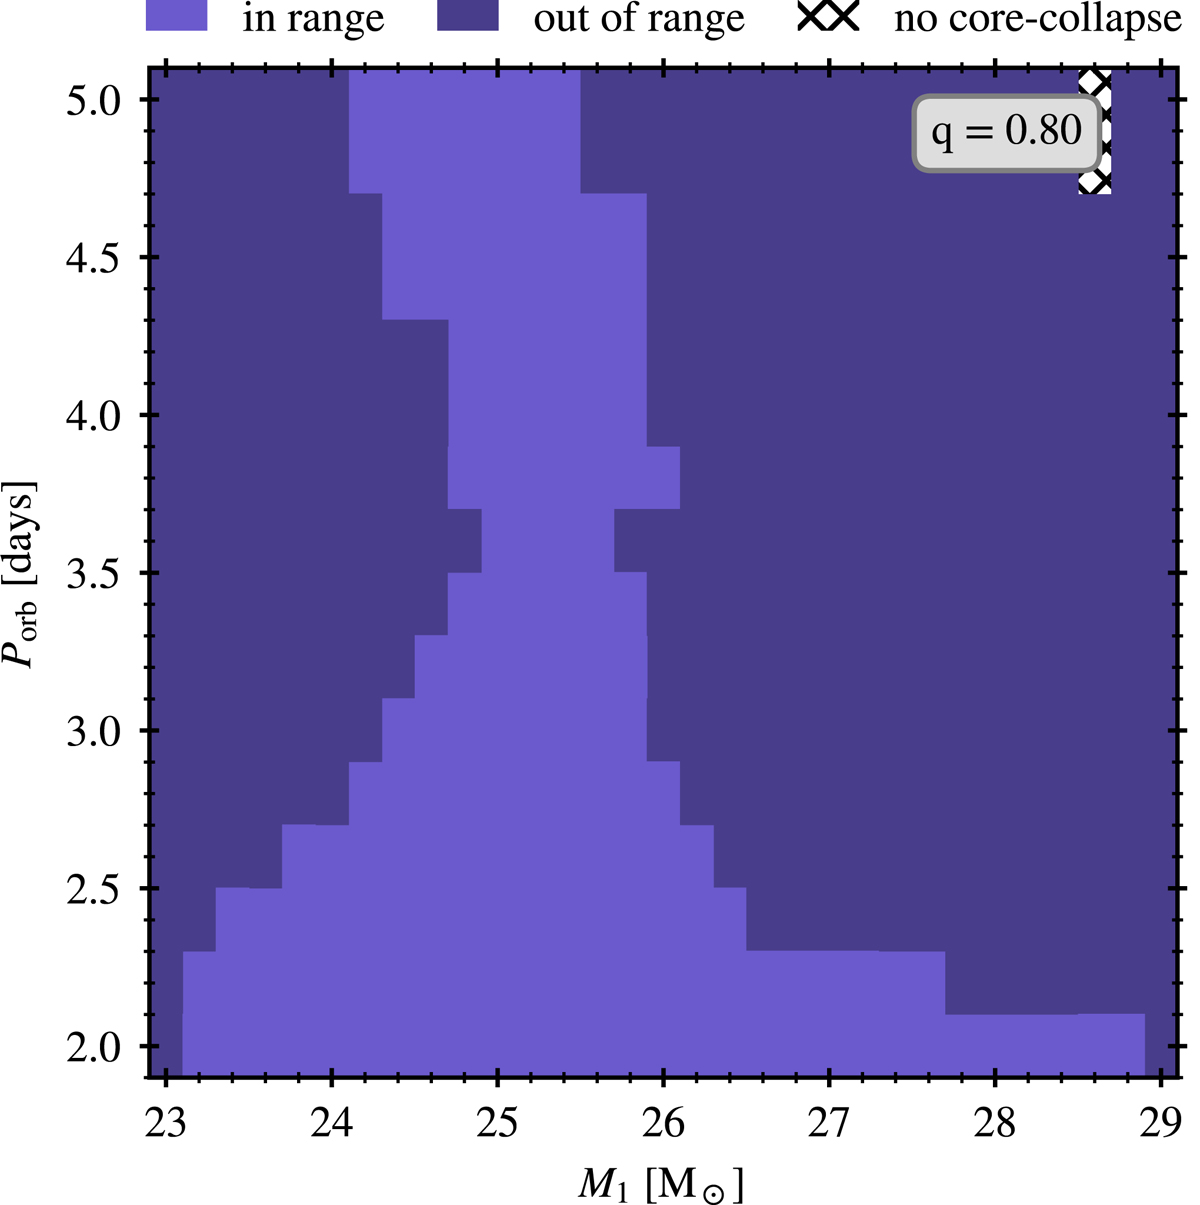
Example of a grid of binary systems showing initial periods (in days) and initial primary masses for a fixed initial mass ratio of q = 0.8. Each rectangle represents a single detailed binary evolution model. Light blue is used for binaries with a primary collapsing into a NS while having a companion mass within the values derived by Kaper et al. (2006) (named ‘in range’). In a darker blue colour, we show binaries with primaries forming BHs or being outside the constraint imposed by the observed masses (named ‘out of range’). The hatched region represents a binary that ends its evolution without reaching a core-collapse stage. For the entire grid of models computed, we find that these non-collapsing models either merge during a CE phase between two non-degenerate stars, or stop due to numerical issues. Other initial mass ratios produce similar results.
Current usage metrics show cumulative count of Article Views (full-text article views including HTML views, PDF and ePub downloads, according to the available data) and Abstracts Views on Vision4Press platform.
Data correspond to usage on the plateform after 2015. The current usage metrics is available 48-96 hours after online publication and is updated daily on week days.
Initial download of the metrics may take a while.