Fig. 1.
Download original image
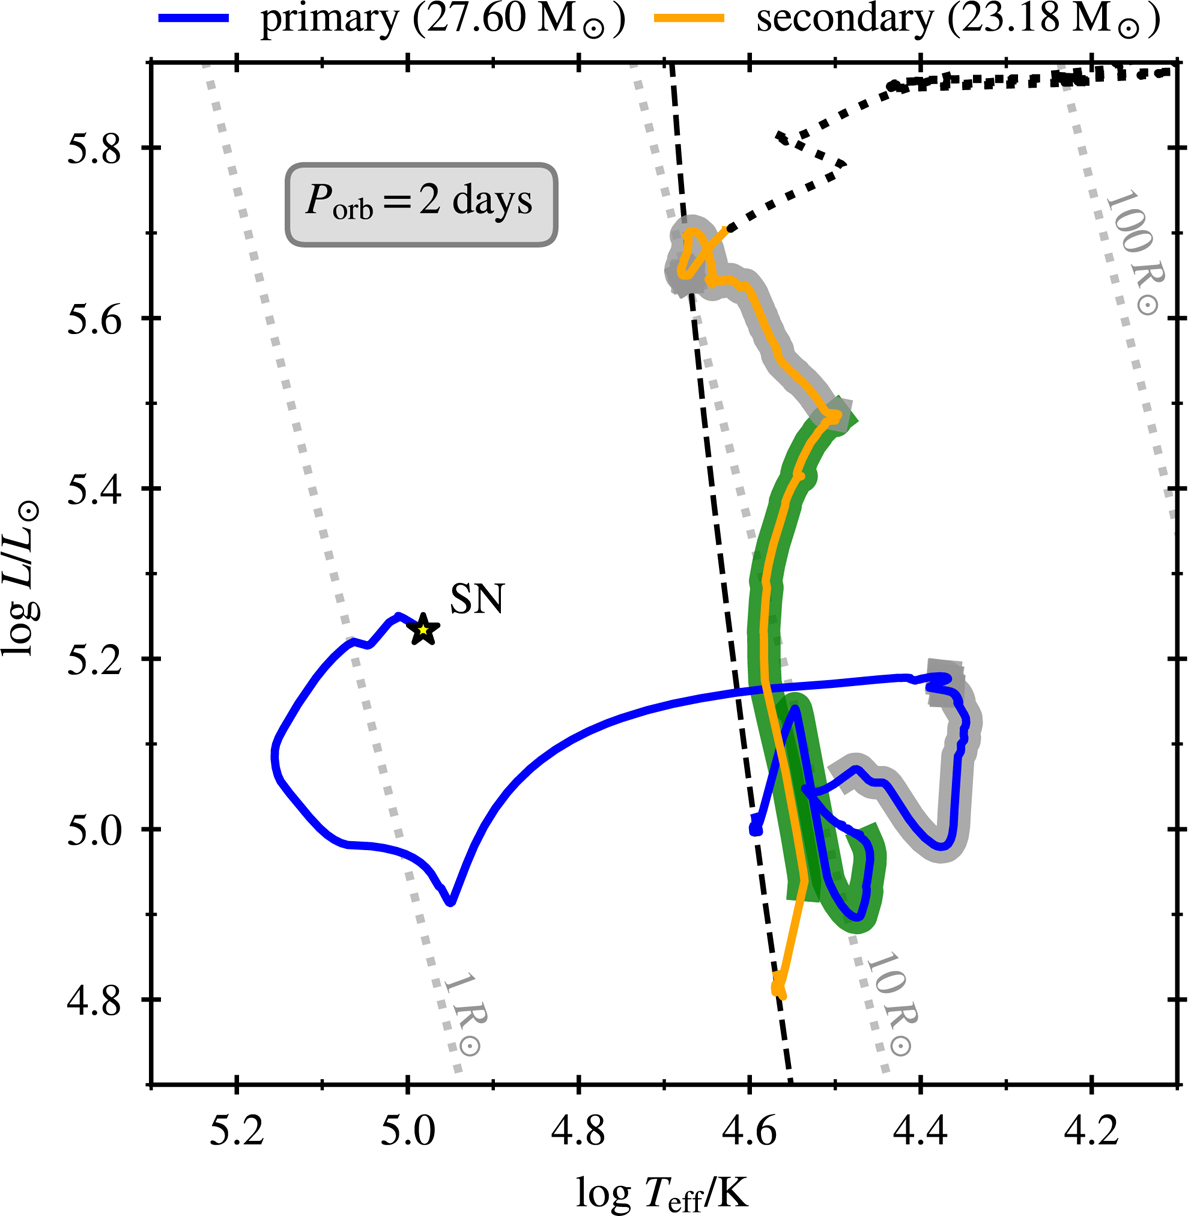
Evolutionary tracks in the HR diagram of a close binary system with an initial primary mass of 27.60 M⊙ and a secondary mass of 23.18 M⊙. This binary is assumed to start its evolution in a circular orbit with Porb = 2 days, in a fully conservative MT scenario throughout its entire lifetime. The evolution of the primary (secondary) star is represented in solid blue (orange) line. Different MT phases are plotted on top of each star: in green (grey) we show Case A (early Case B) MT. The dotted grey lines represent constant radii for 1, 10, and 100 R⊙, while the dotted black line designates the evolution of the secondary star after the formation of the first compact object (GX 301–2) if the companion NS star was absent. The yellow star marks the location where the primary exploded as a SN. For comparison, the ZAMS corresponding to stars of the same composition is shown by the black dashed line.
Current usage metrics show cumulative count of Article Views (full-text article views including HTML views, PDF and ePub downloads, according to the available data) and Abstracts Views on Vision4Press platform.
Data correspond to usage on the plateform after 2015. The current usage metrics is available 48-96 hours after online publication and is updated daily on week days.
Initial download of the metrics may take a while.