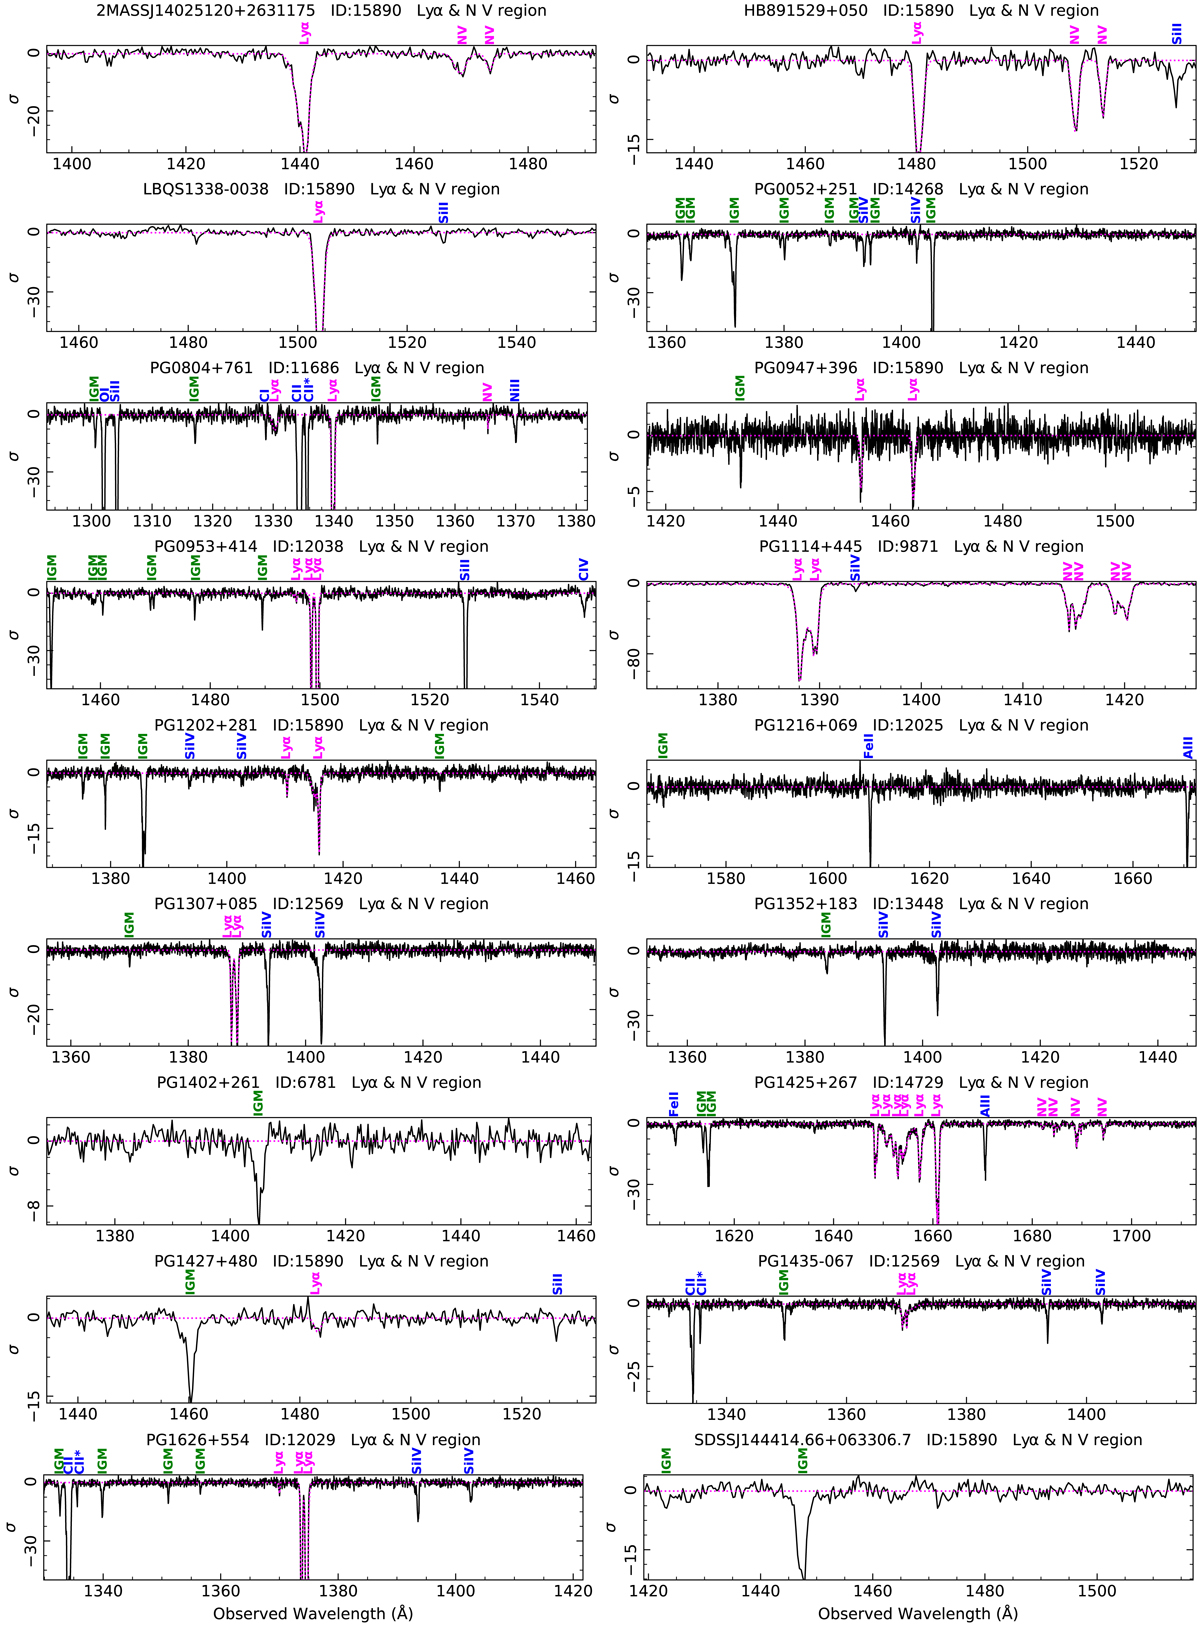
Fig. 2.
Download original image
Absorption lines in the Lyα and N V region of the HST spectra of the SUBWAYS sample. The continuum and the emission lines are subtracted in the displayed data. The ISM lines are labeled in blue, IGM lines in green, and the intrinsic AGN lines in magenta. The best-fit model to the AGN absorption lines is shown as a dotted magenta line. The significance σ is defined as (D−M)/E, where D is the data, M the continuum+emission line model without absorption, and E the error on the data.
Current usage metrics show cumulative count of Article Views (full-text article views including HTML views, PDF and ePub downloads, according to the available data) and Abstracts Views on Vision4Press platform.
Data correspond to usage on the plateform after 2015. The current usage metrics is available 48-96 hours after online publication and is updated daily on week days.
Initial download of the metrics may take a while.