Fig. 9
Download original image
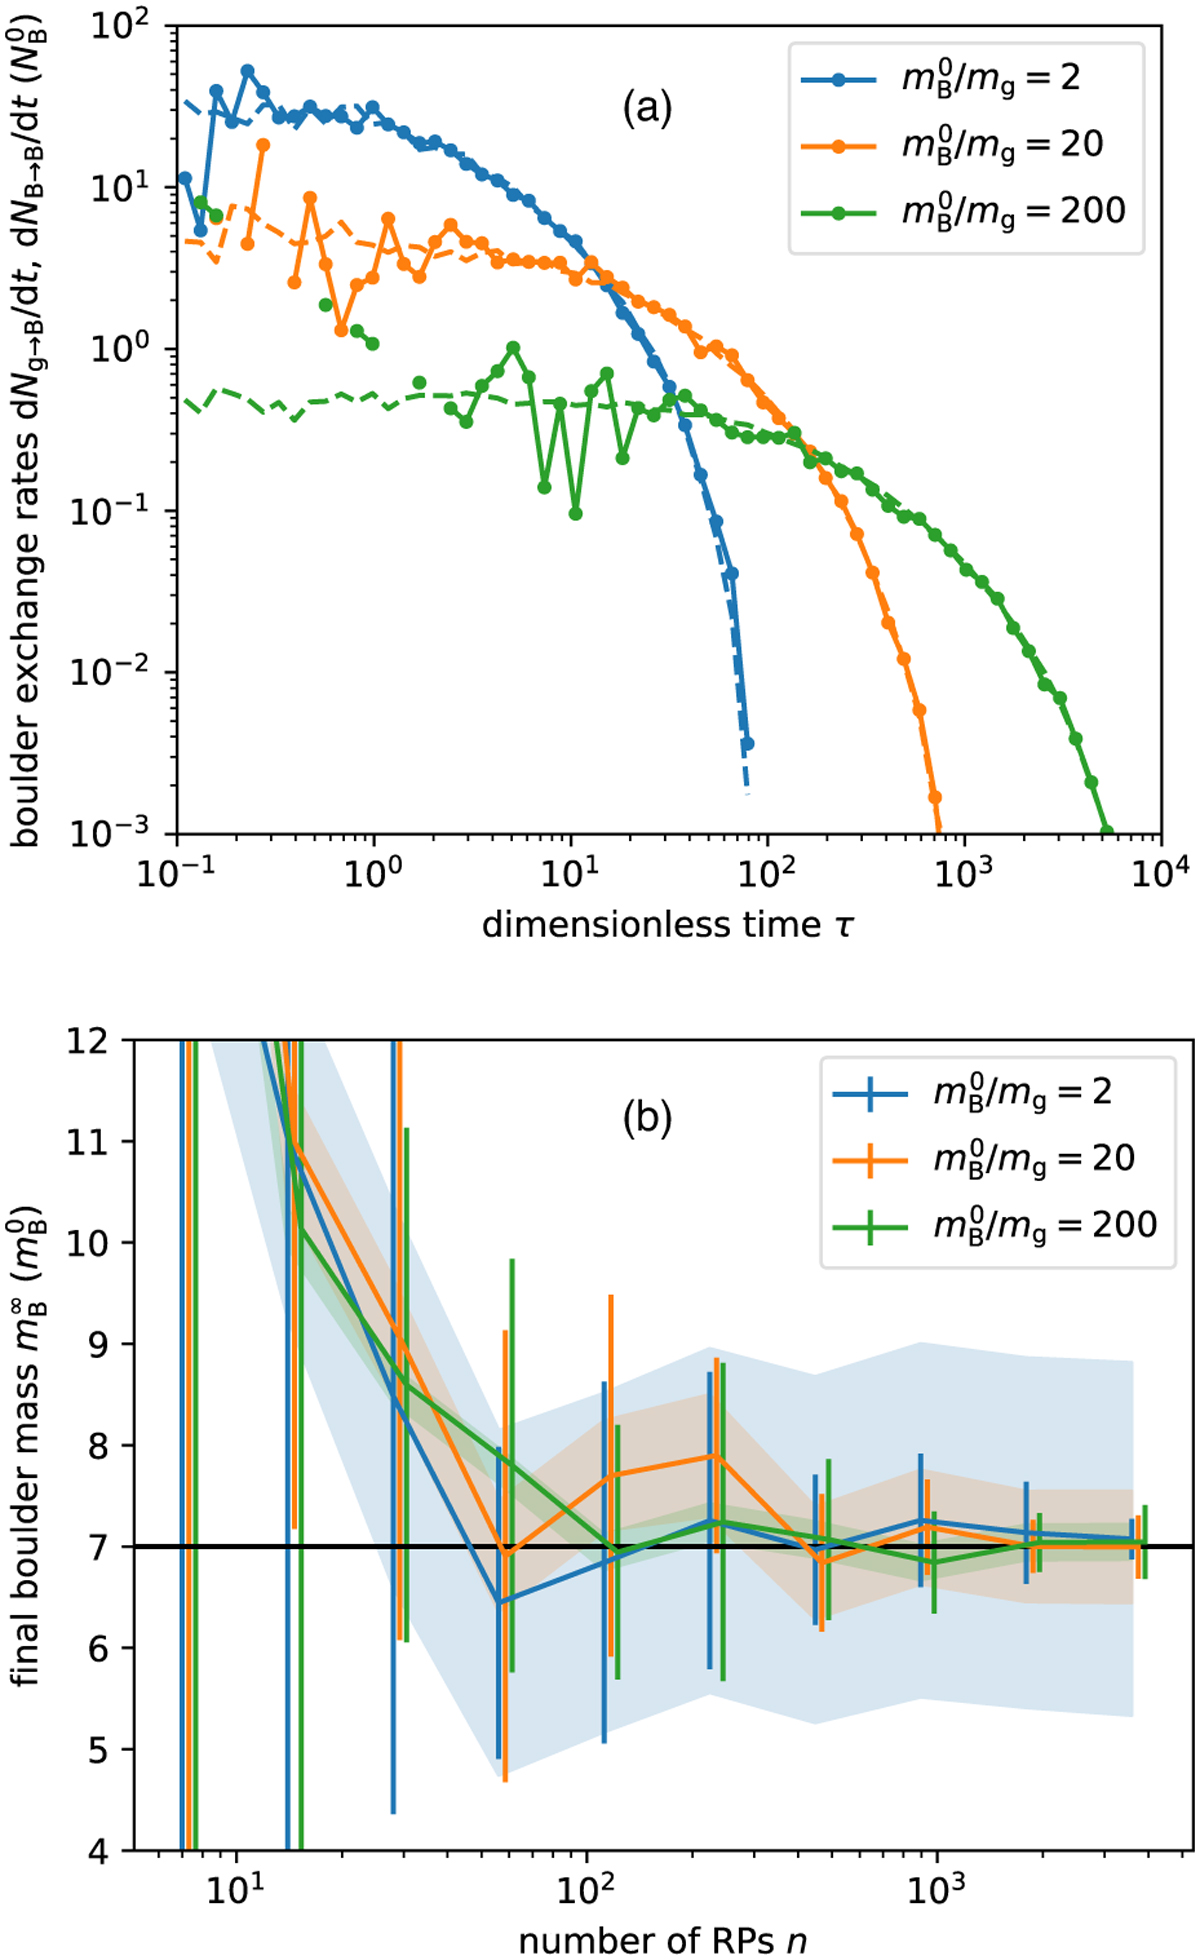
Further analysis of the RPMC simulation of the grains-and-boulders model: (a) contributions to dNB/dt: dNg→B/dt (solid curve), −dNB→B/dt (dashed curve); (b) statistics of final boulder mass ![]() as a function of RP count n: standard deviation of the mean over 10 runs (error bars) and physical spread
as a function of RP count n: standard deviation of the mean over 10 runs (error bars) and physical spread ![]() (filled area). Simulation parameters as in Fig. 8. In (a), the full n = 1 792 RPs were used; in (b), the number of RPs was varied. n was divided into nB boulder-mass RPs and ng = 6nB grain-mass RPs with equal-weight swarms, Mi = Mj∀i, j ∈ {1, …, n}. The horizontal black line indicates the expected final boulder mass
(filled area). Simulation parameters as in Fig. 8. In (a), the full n = 1 792 RPs were used; in (b), the number of RPs was varied. n was divided into nB boulder-mass RPs and ng = 6nB grain-mass RPs with equal-weight swarms, Mi = Mj∀i, j ∈ {1, …, n}. The horizontal black line indicates the expected final boulder mass ![]() .
.
Current usage metrics show cumulative count of Article Views (full-text article views including HTML views, PDF and ePub downloads, according to the available data) and Abstracts Views on Vision4Press platform.
Data correspond to usage on the plateform after 2015. The current usage metrics is available 48-96 hours after online publication and is updated daily on week days.
Initial download of the metrics may take a while.