Fig. 8
Download original image
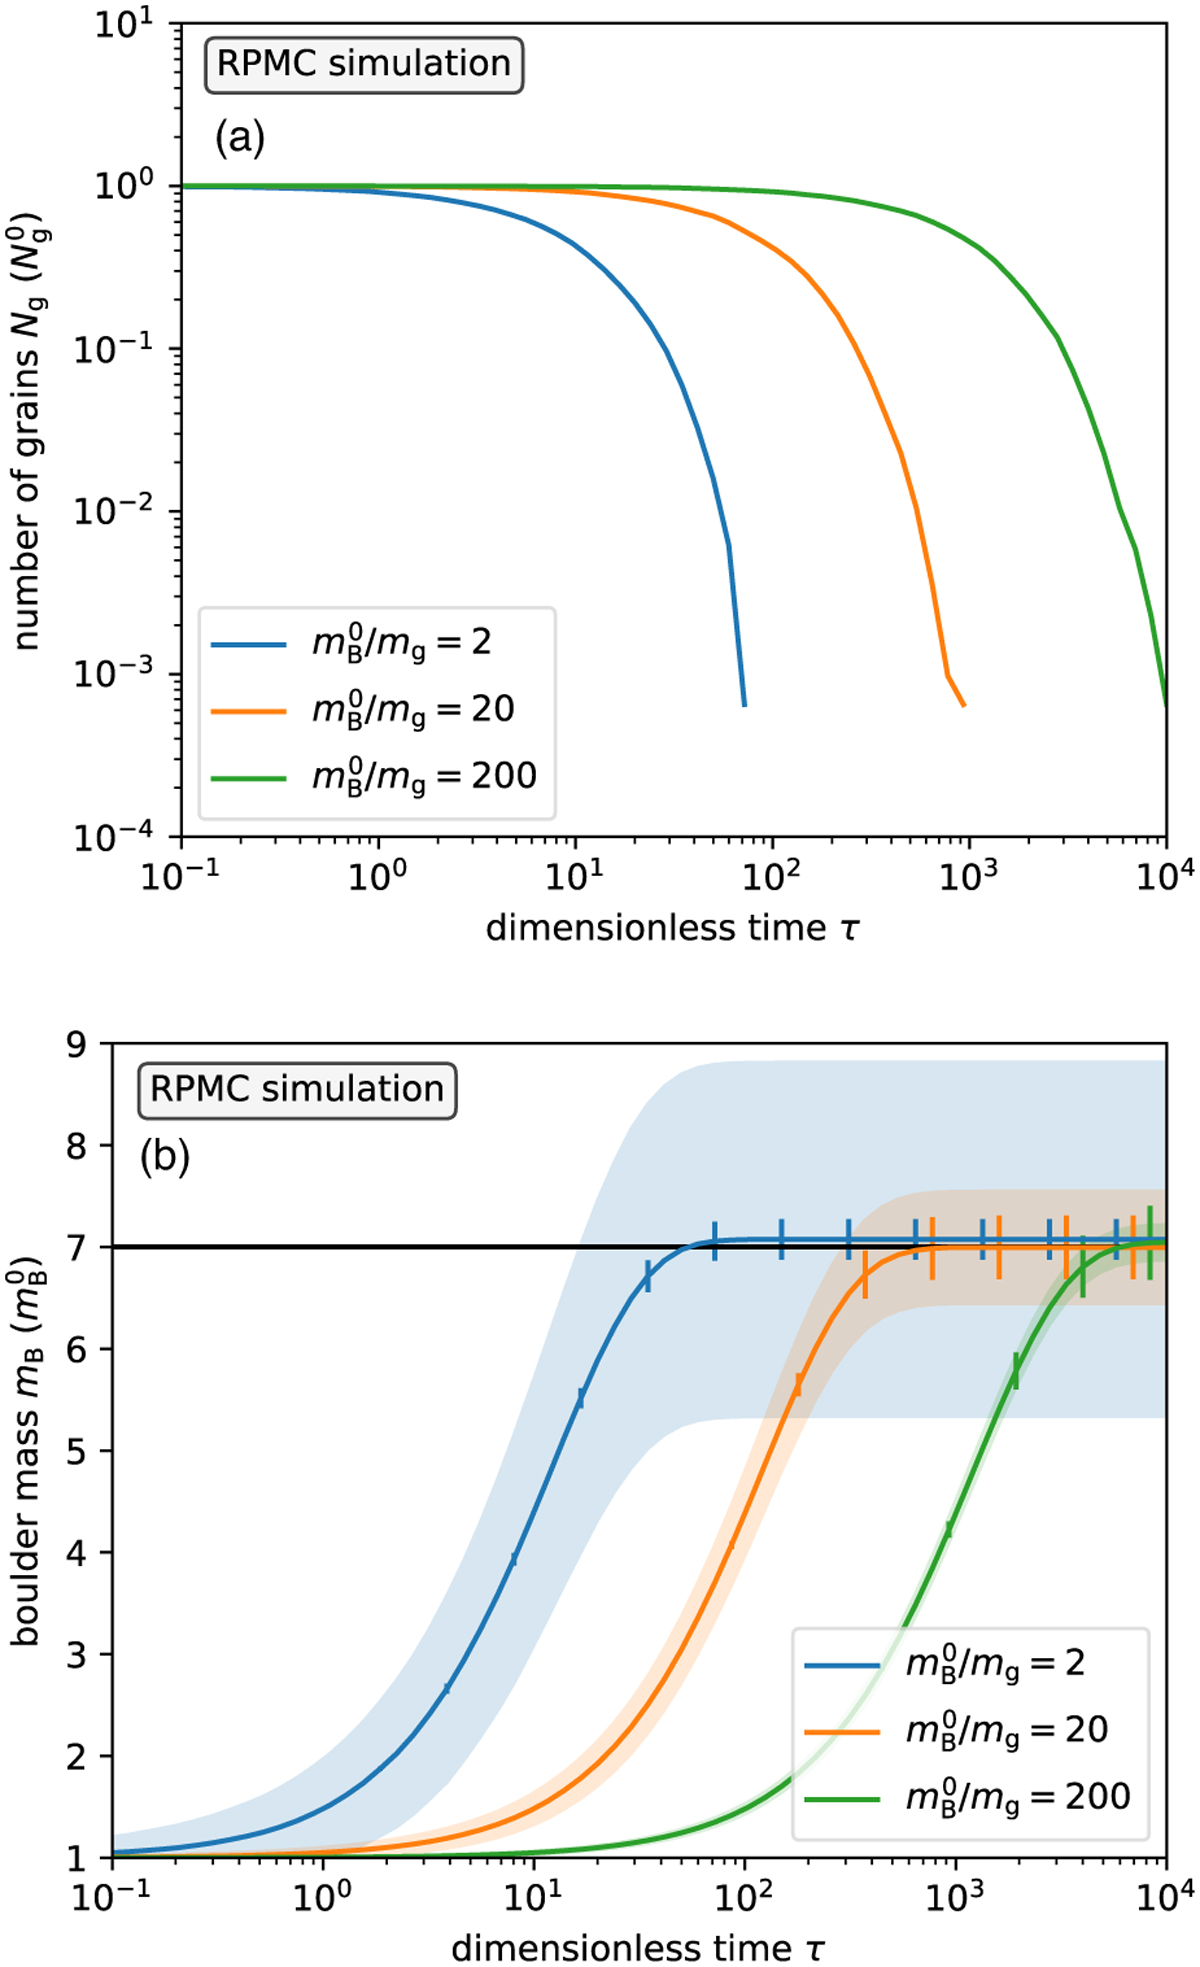
RPMC simulation of the grains-and-boulders model introduced in Sect. 5 for different boulder–grain particle mass ratios for comparison with Fig. 7: (a) total number of grains Ng; (b) average boulder mass 〈m〉B. The simulation uses n = 1 792 RPs divided into nB = 256 boulder-mass RPs and ng = 6nB = 1 536 grain-mass RPs with equal-weight swarms, Mi = Mj ∀i, j ∈ {1, …, n}, and an initial number of ![]() grains. The boulder masses in (b) are averaged over 1 consecutive runs; the filled area indicates the physical spread
grains. The boulder masses in (b) are averaged over 1 consecutive runs; the filled area indicates the physical spread ![]() of the mass distribution, and the error bars indicate the standard deviation of the mean boulder mass over 1 runs. The horizontal black line indicates the expected final boulder mass
of the mass distribution, and the error bars indicate the standard deviation of the mean boulder mass over 1 runs. The horizontal black line indicates the expected final boulder mass ![]() .
.
Current usage metrics show cumulative count of Article Views (full-text article views including HTML views, PDF and ePub downloads, according to the available data) and Abstracts Views on Vision4Press platform.
Data correspond to usage on the plateform after 2015. The current usage metrics is available 48-96 hours after online publication and is updated daily on week days.
Initial download of the metrics may take a while.