Fig. 6
Download original image
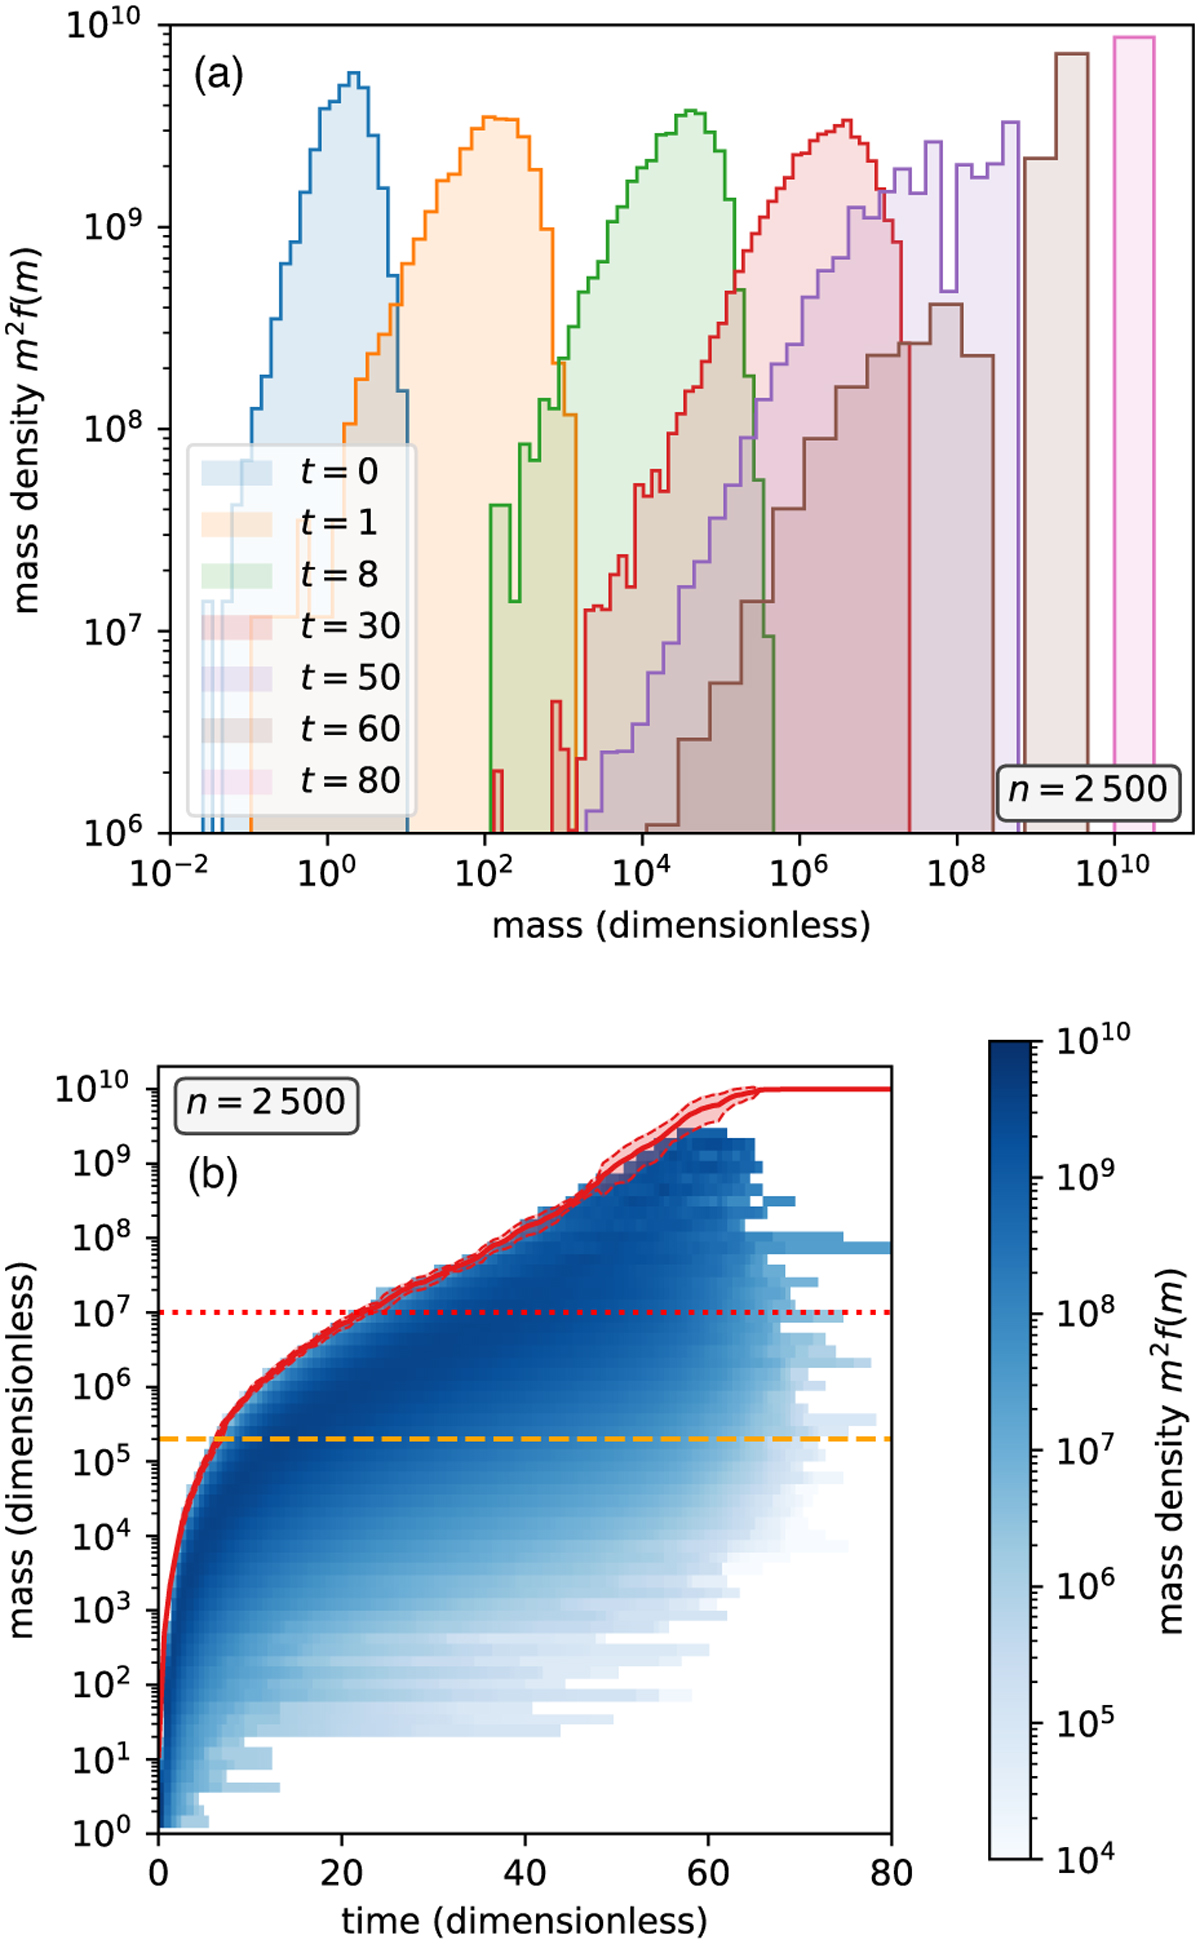
RPMC simulation with the runaway collision rate in Eq. (93), a dimensionless threshold mass of mth = 107 (indicated by dotted red horizontal line in (b)), a total mass of M = 1010, a homogeneous swarm mass distribution, a particle number threshold of Nth = 20, and n = 2500 RPs. Every individual swarm i has mass Mi = M/n; particles are resolved individually once they grow beyond the mass M/(nNth) (indicated by the dashed orange horizontal line in (b)). Each panel shows a time series of histograms. The mass-weighted particle number density is shown on the vertical axis of (a), whereas in (b) the mass-weighted histogram bin counts are colour-encoded on a logarithmic scale, and the mass of the runaway particle is shown separately (red curve). Histogram bin counts and mass of runaway particle are averaged over 10 runs, the error bounds of the runaway particle being indicated by red dashed curves.
Current usage metrics show cumulative count of Article Views (full-text article views including HTML views, PDF and ePub downloads, according to the available data) and Abstracts Views on Vision4Press platform.
Data correspond to usage on the plateform after 2015. The current usage metrics is available 48-96 hours after online publication and is updated daily on week days.
Initial download of the metrics may take a while.