Fig. 4
Download original image
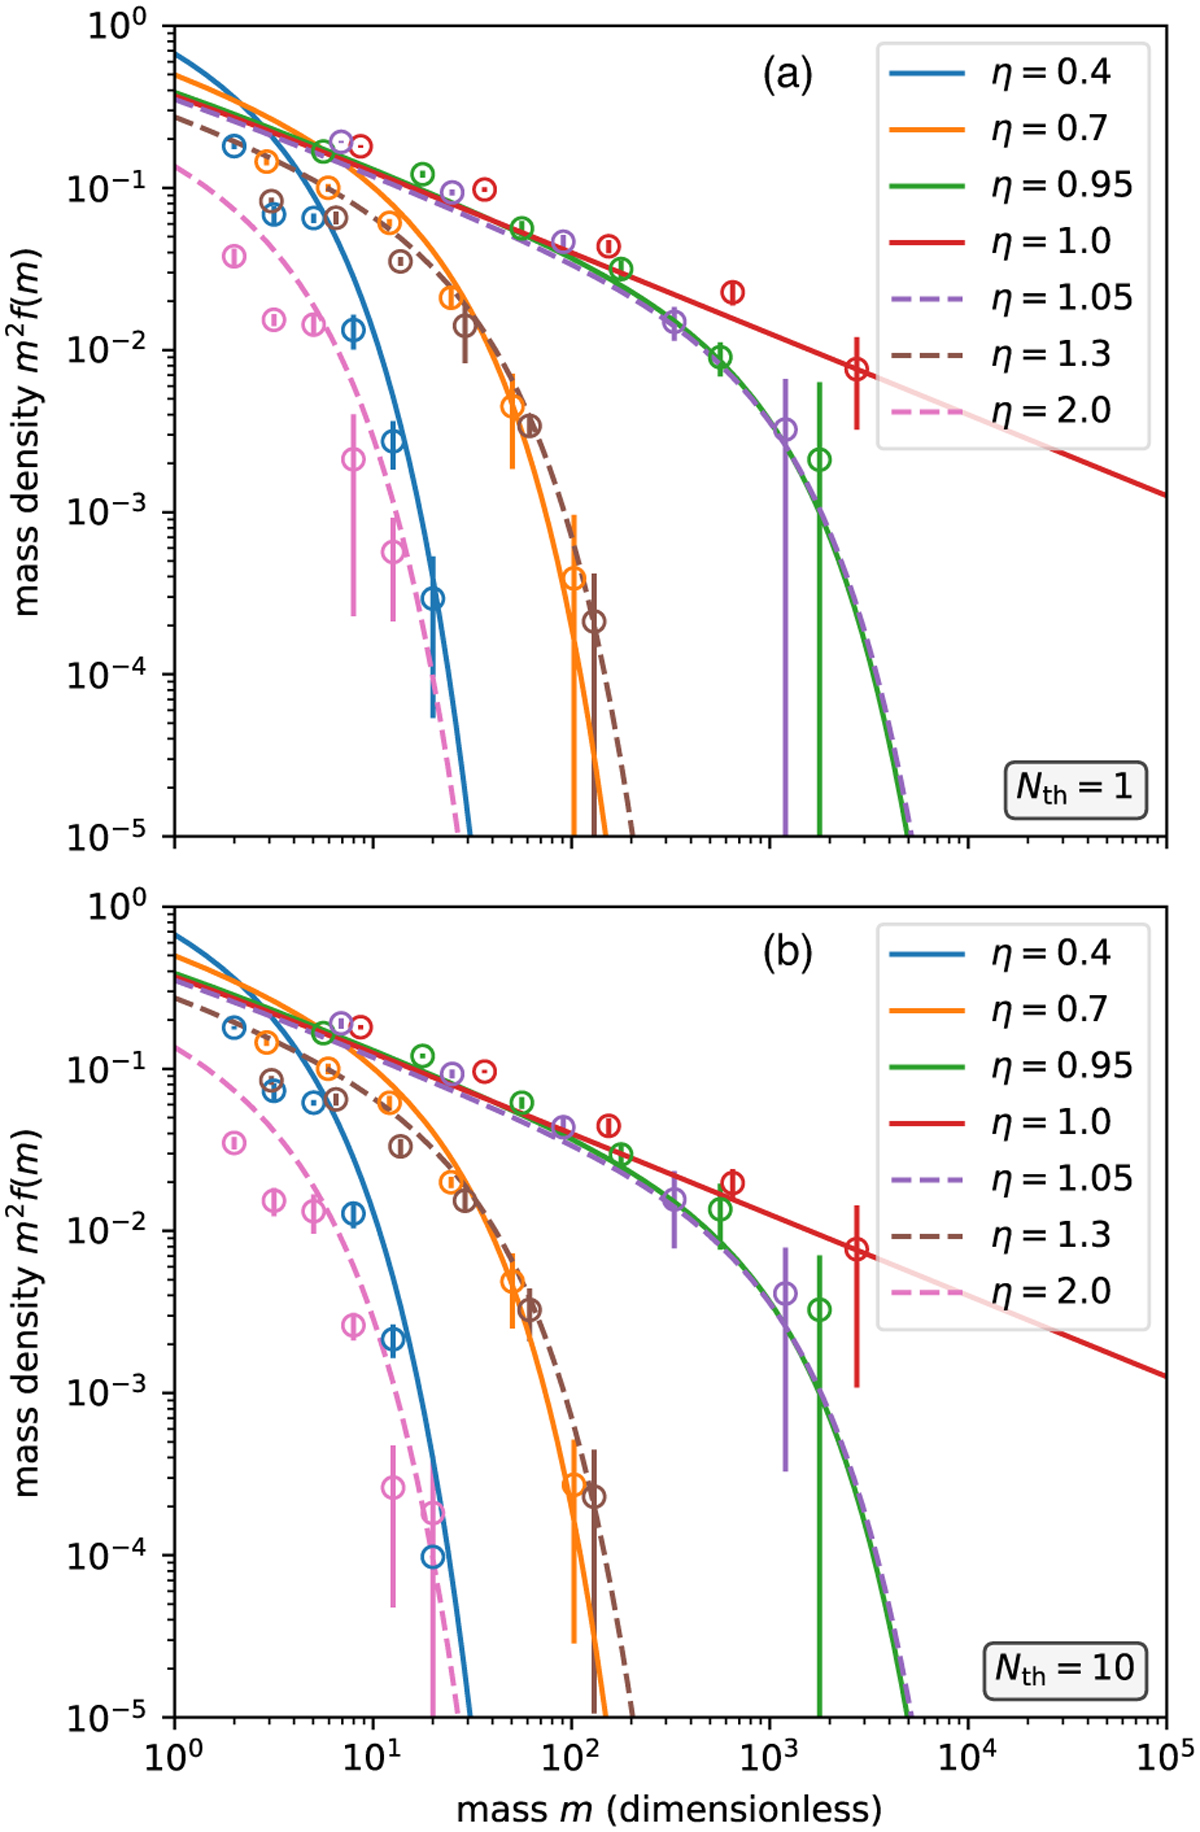
Particle mass density at different times for the product kernel coagulation test, compared to the analytical solution in Eq. (A.9) (solid curves). The RPMC simulation uses n = 2 048 particles and different values of the particle number threshold: (a) Nth = 1; (b) Nth = 10. The results shown were averaged over 5 runs, with a standard deviation indicated by the error bars.
Current usage metrics show cumulative count of Article Views (full-text article views including HTML views, PDF and ePub downloads, according to the available data) and Abstracts Views on Vision4Press platform.
Data correspond to usage on the plateform after 2015. The current usage metrics is available 48-96 hours after online publication and is updated daily on week days.
Initial download of the metrics may take a while.