Fig. 8.
Download original image
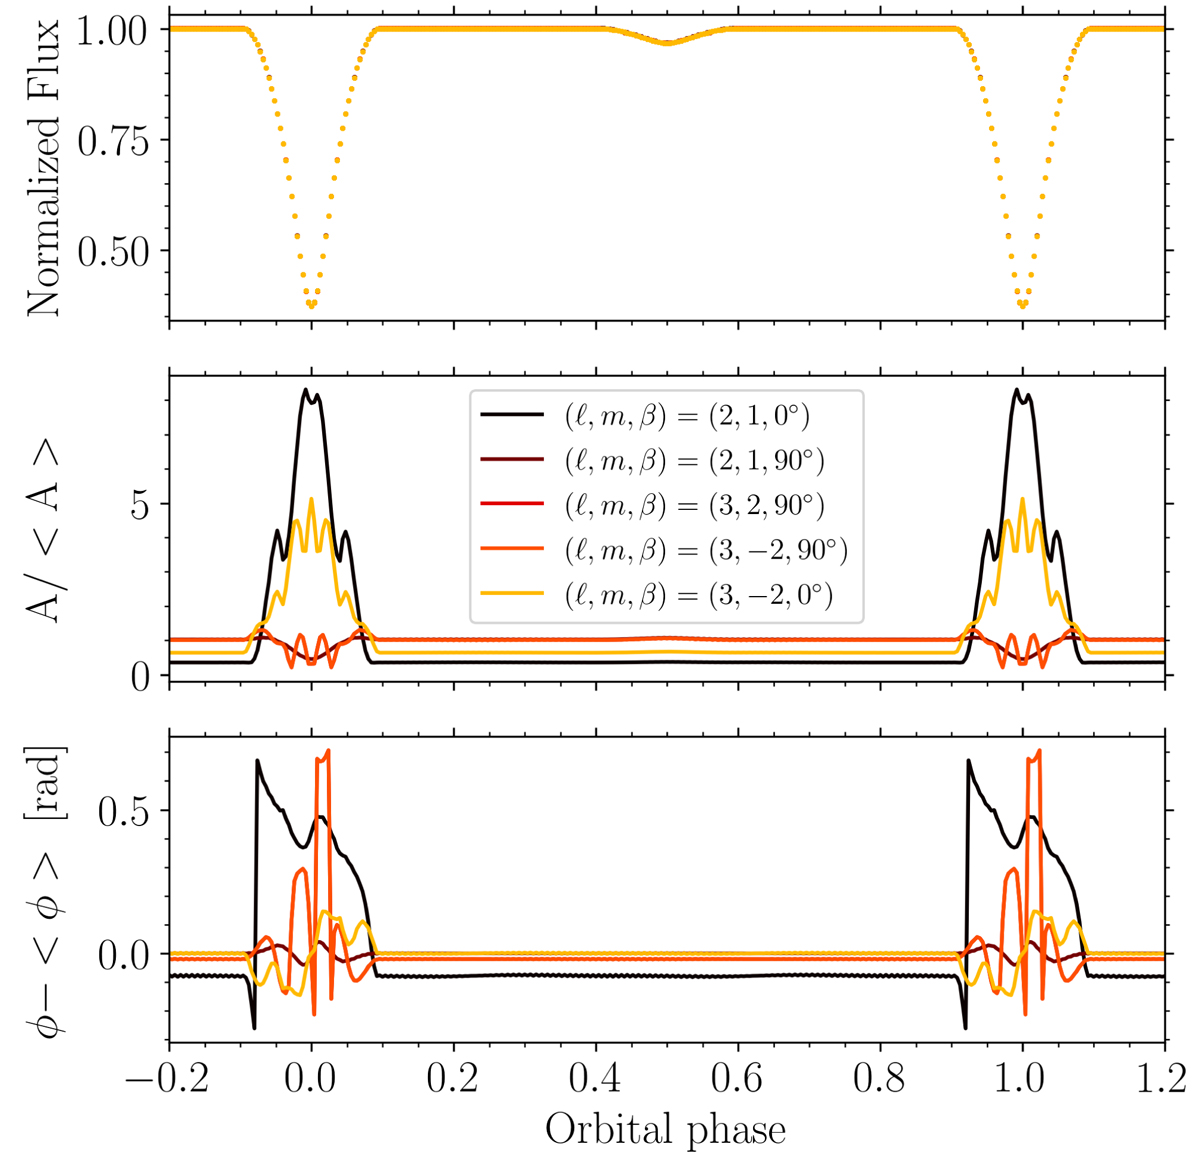
Top: simulated light curves with different pulsation configurations (ℓ, m, β) phase folded over the binary period. The points from the other simulated light curves are poorly visible due to the strong overlap between the models and the size of the markers. Middle: mode amplitude variations for different pulsation configurations as seen by an observer because of changing partial cancellation effects. Bottom: mode phase variations for different pulsation configurations as seen by an observer.
Current usage metrics show cumulative count of Article Views (full-text article views including HTML views, PDF and ePub downloads, according to the available data) and Abstracts Views on Vision4Press platform.
Data correspond to usage on the plateform after 2015. The current usage metrics is available 48-96 hours after online publication and is updated daily on week days.
Initial download of the metrics may take a while.