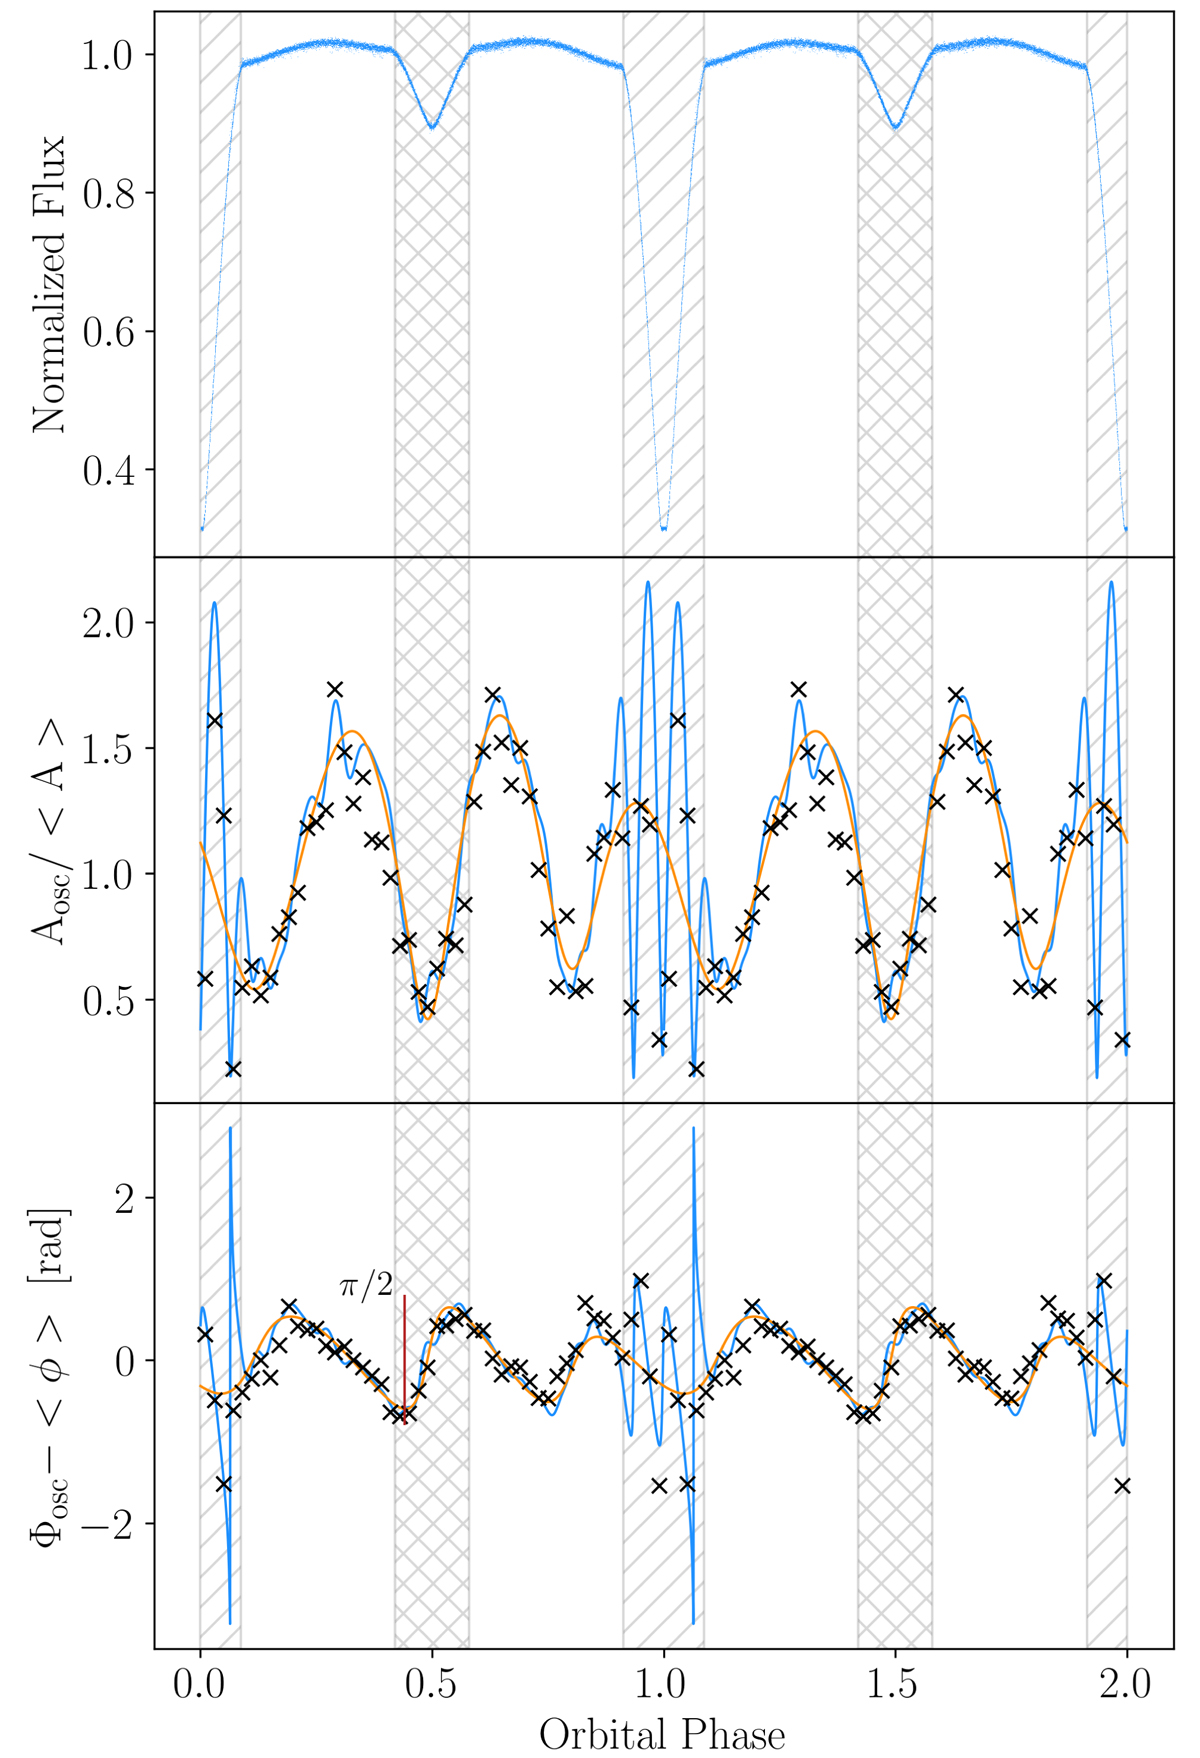
Fig. 10.
Download original image
Top: phase-folded light curve of U Gru for sector 1. Middle: amplitude modulation of f14 = 33.046 d−1 as reconstructed according to the fitting method developed by Jayaraman et al. (2022). The blue considers all 14 significant frequencies split from f14 listed in Table 3. The orange lines only consider those frequencies with f = f14 ± Nforb, where −3 ≤ N ≤ 3, if they were found to be significant in the iterative pre-whitening procedure. Tracked mode amplitudes from Sect. 4 are shown as black crosses. Bottom: same as the middle panel but for the phase modulation. Grey hatching denotes phases of primary (forward hatching) and secondary (cross hatching) eclipse.
Current usage metrics show cumulative count of Article Views (full-text article views including HTML views, PDF and ePub downloads, according to the available data) and Abstracts Views on Vision4Press platform.
Data correspond to usage on the plateform after 2015. The current usage metrics is available 48-96 hours after online publication and is updated daily on week days.
Initial download of the metrics may take a while.