Fig. 9
Download original image
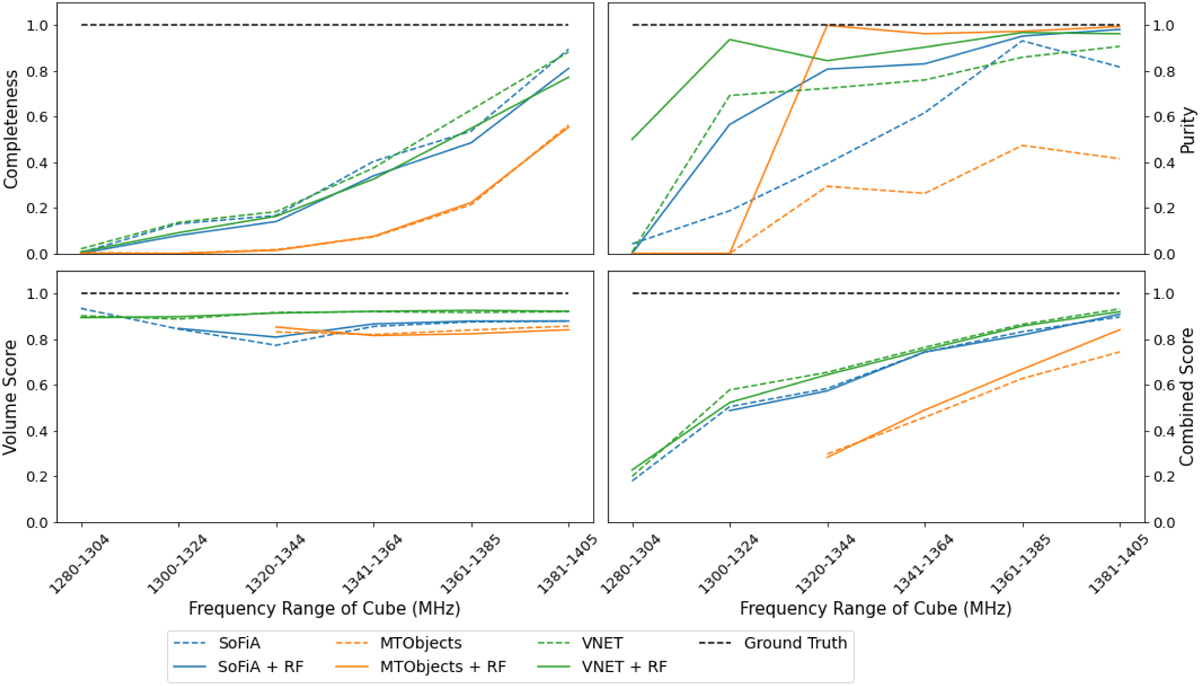
Various evaluation metrics of the three source finders evaluated with both the mock galaxies and the real sources as a function of the frequency range corresponding to each spectral window. For each plot, the results of SoFiA are shown in blue, the results of MTO in orange, and the results of the V-Net network in green, and the ground truth is shown as a dashed black line. The panel at the top left shows the completeness and the top right shows the purity. The mask quality is shown with the volume score in the bottom-left plot, and the combination of all merging scores, purity, and completeness is shown with the combined score in the bottom-right plot. For all the plots the x-axis shows the frequency range associated with each of the spectral windows of the Apertif test pointing.
Current usage metrics show cumulative count of Article Views (full-text article views including HTML views, PDF and ePub downloads, according to the available data) and Abstracts Views on Vision4Press platform.
Data correspond to usage on the plateform after 2015. The current usage metrics is available 48-96 hours after online publication and is updated daily on week days.
Initial download of the metrics may take a while.