Fig. 8
Download original image
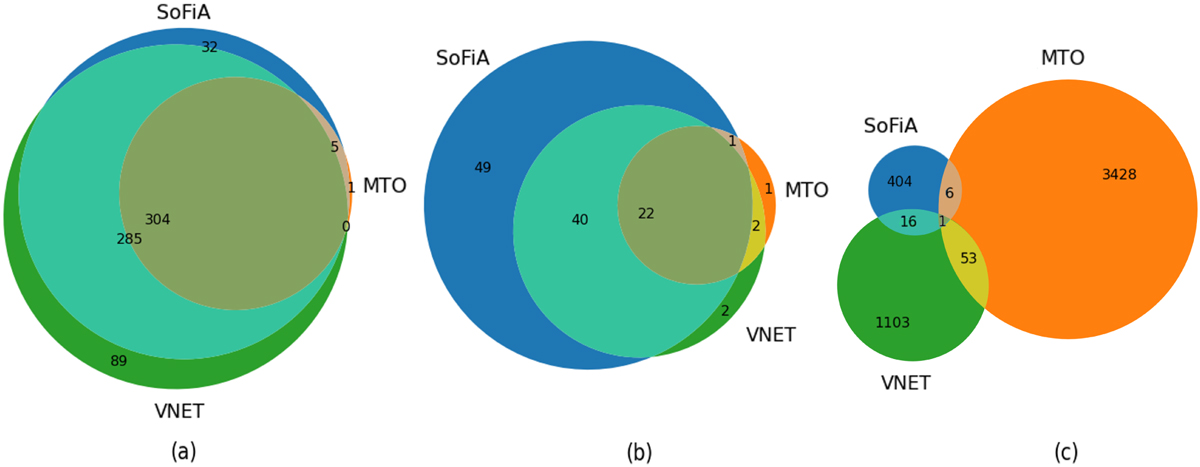
Venn diagrams of the total number of each kind of detection for all six spectral windows of the Apertif test pointing by each source-finding method prior to applying the random forest classifier. (a) Number of detected mock galaxies. (b) Number of detected real sources. (c) Number of detected false positives. SoFiA is represented by the blue circle, MTO is represented by the orange circle, and the V-Net network is represented by the green circle.
Current usage metrics show cumulative count of Article Views (full-text article views including HTML views, PDF and ePub downloads, according to the available data) and Abstracts Views on Vision4Press platform.
Data correspond to usage on the plateform after 2015. The current usage metrics is available 48-96 hours after online publication and is updated daily on week days.
Initial download of the metrics may take a while.