Open Access
Fig. 6
Download original image
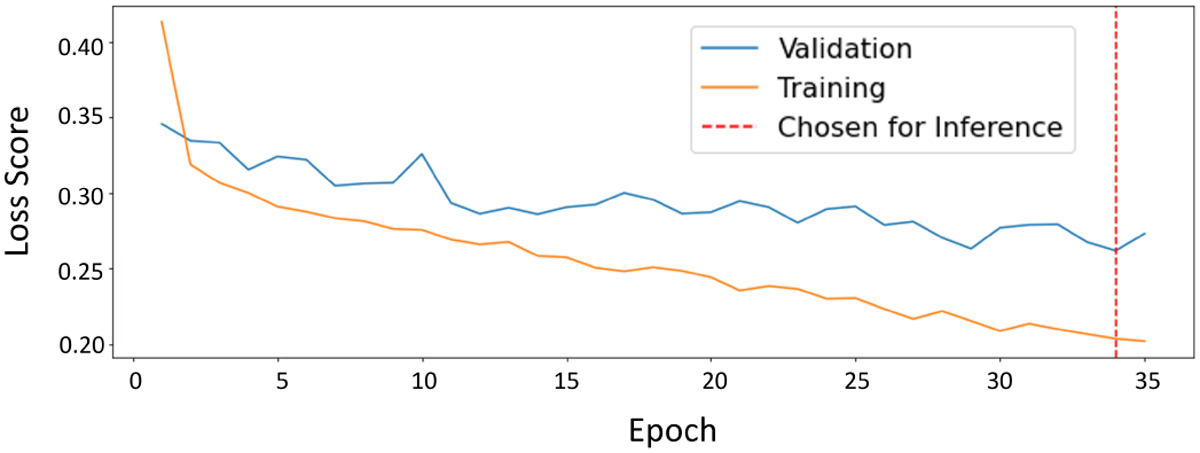
Training and validation loss scores of the V-Net network per epoch during the training process. The blue line shows the validation loss score and the orange line the training loss score, with the dashed red line indicating the point where the model was taken for inference.
Current usage metrics show cumulative count of Article Views (full-text article views including HTML views, PDF and ePub downloads, according to the available data) and Abstracts Views on Vision4Press platform.
Data correspond to usage on the plateform after 2015. The current usage metrics is available 48-96 hours after online publication and is updated daily on week days.
Initial download of the metrics may take a while.